FTSE 100, DAX 40, S&P 500 Analysis and Charts
FTSE 100 remains side-lined
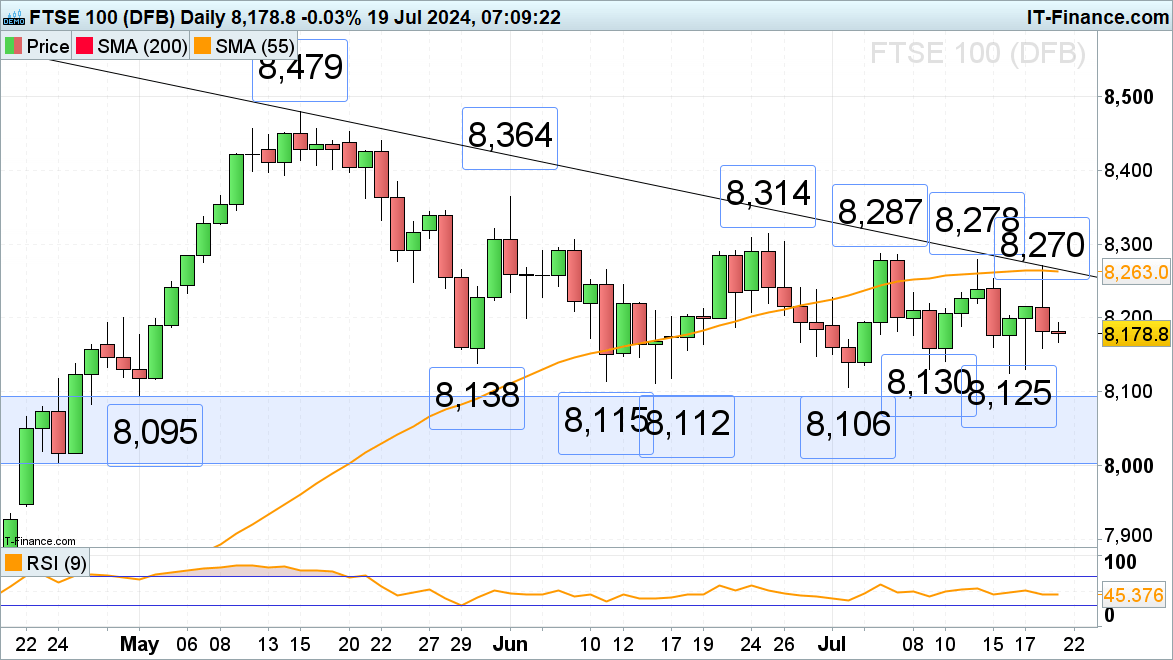
The FTSE 100 continues to range trade but is seeing a series of lower highs along the 55-day simple moving average (SMA) at 8,263 which this week acted as resistance. On the flip side, the May-to-July lows at 8,138 to 8,106 continue to act as solid support.
The July highs at 8,270 to 8,287 need to be overcome, for the late June peak at 8,314 to be reached. Similarly, a fall through and daily chart close below the 8,106 early July low may lead to the early- April-to-early-May lows at 8,095 to 8,017 being revisited.
FTSE100 Daily Chart
DAX 40 sees four straight days of losses
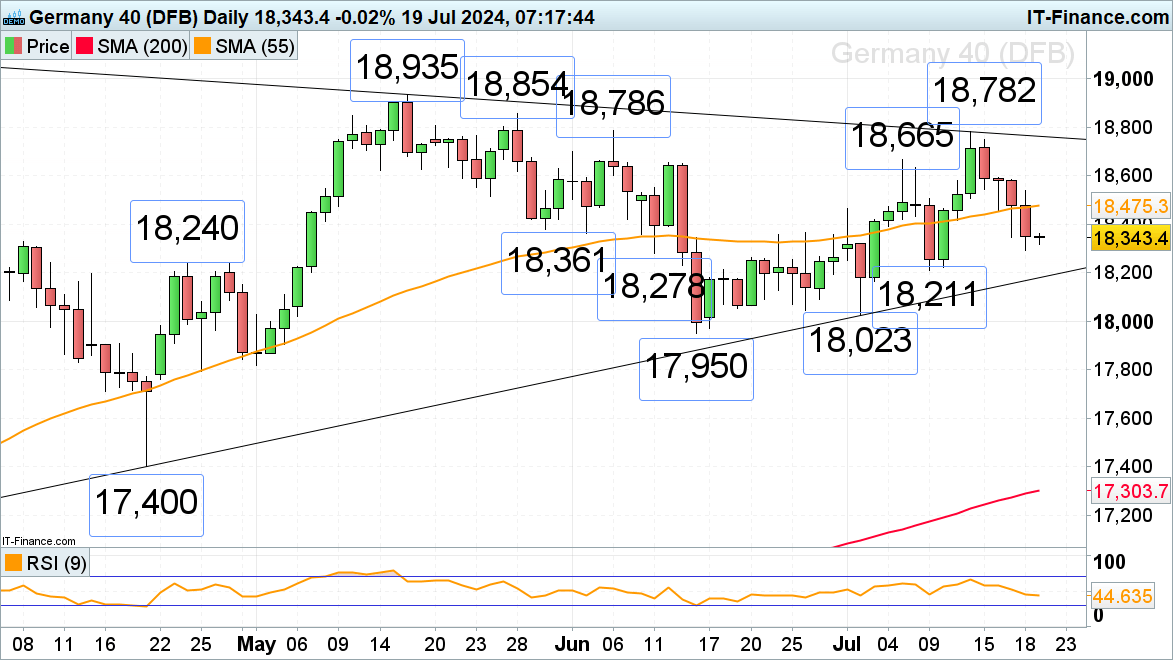
The DAX 40’s advance to last Friday’s 18,782 high, made close to the 18,786 early June peak, has been followed by four consecutive days of losses with perhaps a fifth being seen today with the 9 July low at 18,211 representing a possible downside target.
Minor resistance can be spotted along the 55-day simple moving average (SMA) at 18,475.
DAX 40 Daily Chart
S&P 500 comes off its record high
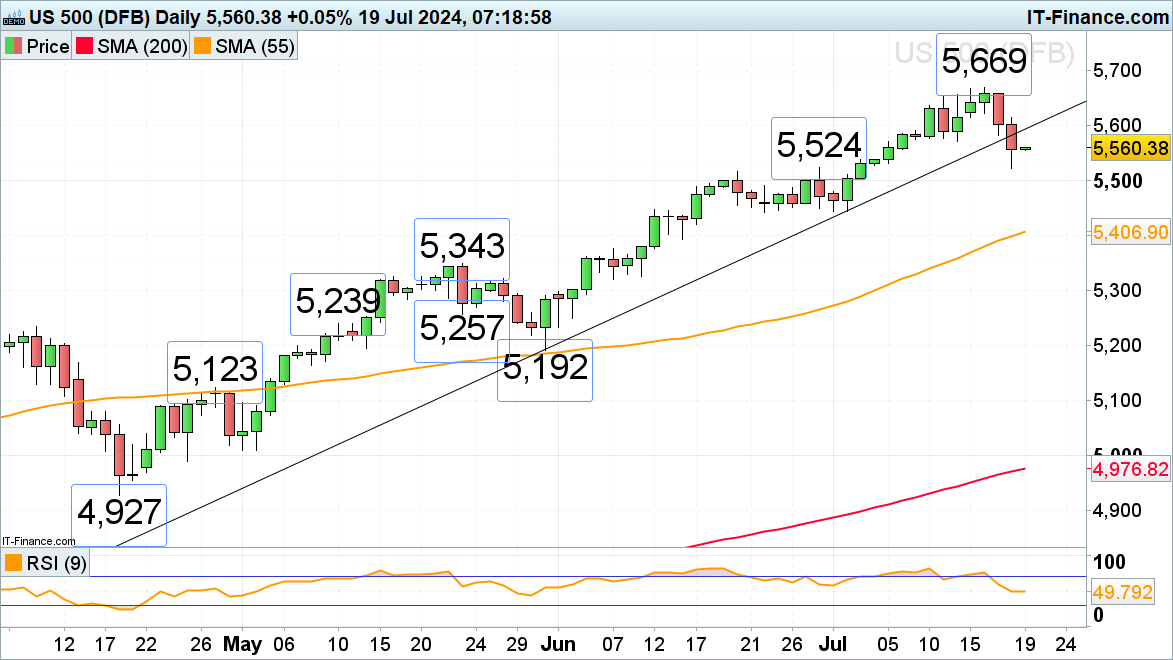
The S&P 500 is starting to come off its 5,669 record high and has now fallen through its May-to-July uptrend line which, because of inverse polarity, should now act as a resistance line at 5,594.
So far the 5,524 June high has acted as support but below it lies the 24 June low at 5,446 which may also act as support in the days to come.
Above the 5,669 all-time high lies the psychological 5,700 mark.
S&P 500 Daily Chart
DailyFX provides forex news and technical analysis on the trends that influence the global currency markets.


