FTSE 100, CAC 40, S&P 500 Analysis and Charts
FTSE 100 to end the week on a positive note
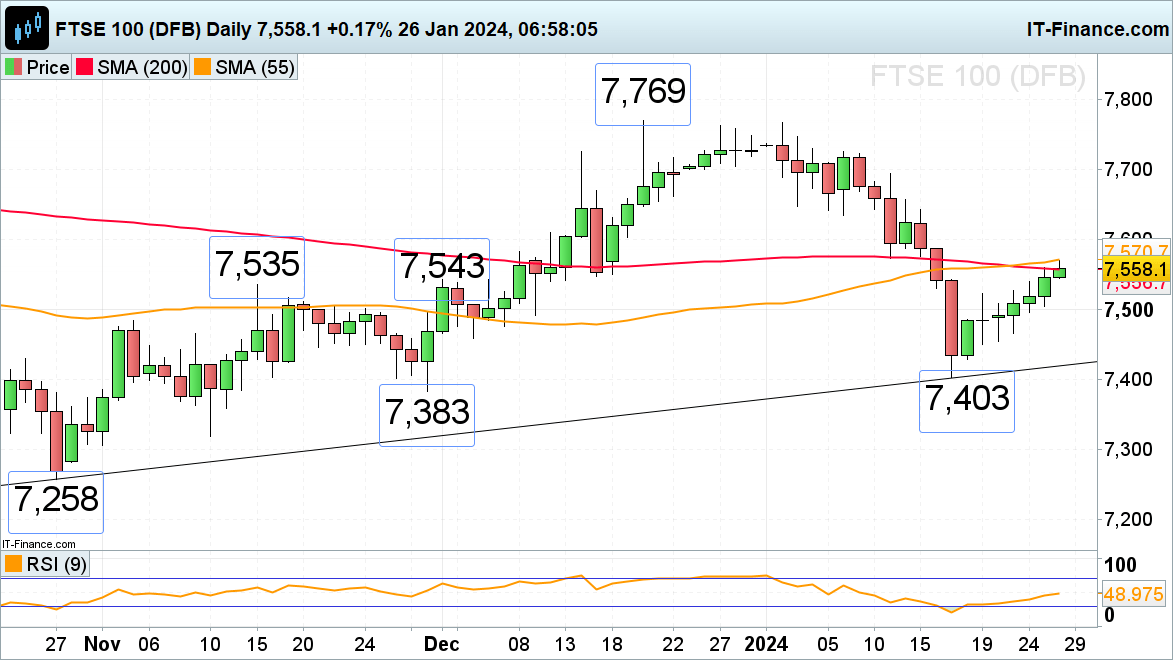
The FTSE 100’s gradual advance from last week’s six-week low at 7,403 has taken it to the 55- and 200-day simple moving averages (SMA) at 7,557 to 7,571 as UK consumer confidence hit a two-year high in January.The moving averages may act as resistance, though, but a rise above 7,571 would target the 8 January low at 7,635.
Potential slips below Wednesday’s 7,539 high may find support between last Friday’s and Tuesday’s highs at 7,523 to 7,527.
FTSE 100 Daily Chart
Retail trader data shows 62.56% of traders are net-long with the ratio of traders long to short at 1.67 to 1. The number of traders net-long is 11.20% lower than yesterday and 20.78% lower than last week, while the number of traders net-short is 21.01% higher than yesterday and 37.42% higher than last week.
See What This Means:
CAC 40 receives lift from ECB press conference
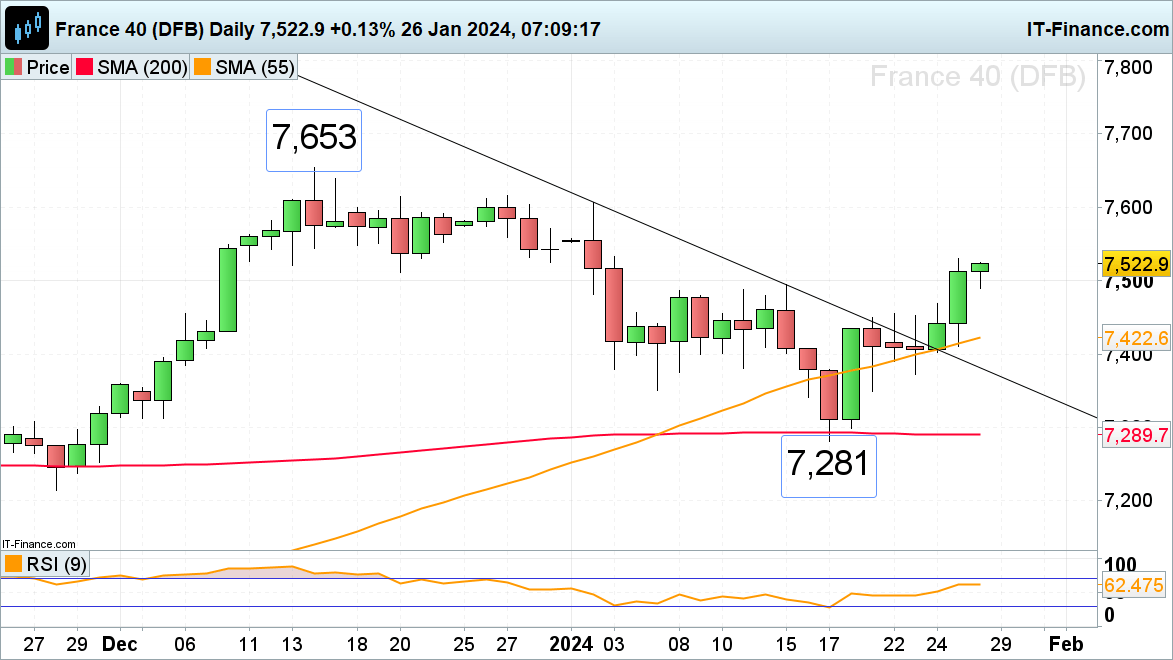
The French CAC 40 stock index rallied on Thursday as the European Central Bank (ECB) maintained its status quo and left rates unchanged with the index hitting a near one-month high at 7,530. Above it beckons the late December to early January resistance area from 7,606 to 7,616.
Support can now be found between 8 to 15 January highs at 7,494 to 7,487. Further support lies between last Friday’s and Wednesday’s highs at 7,468 to 7,450.
CAC 40 Daily Chart
S&P 500 consolidates below record highs
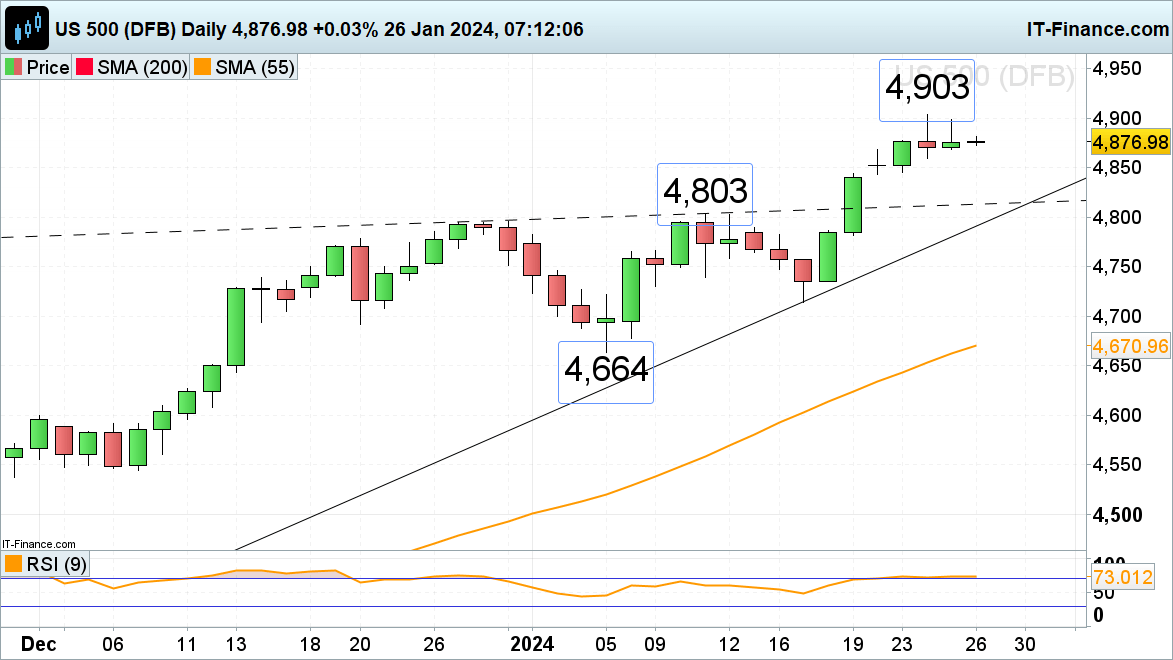
The S&P 500’s advance is beginning to lose upside momentum below its record high around the 4,900 mark as Intel’s earnings disappoint and the company’s share price drops by over 10% in after-hours trading. Minor support below Monday’s 4,868 high can be spotted between last Friday’s high and Tuesday’s lows at 4,845 to 4,844.
A rise above this week’s 4,903 record high would engage the psychological 5,000 mark.
S&P 500 Daily Chart
DailyFX provides forex news and technical analysis on the trends that influence the global currency markets.


