Nikkei 225 regains Monday’s sell-off
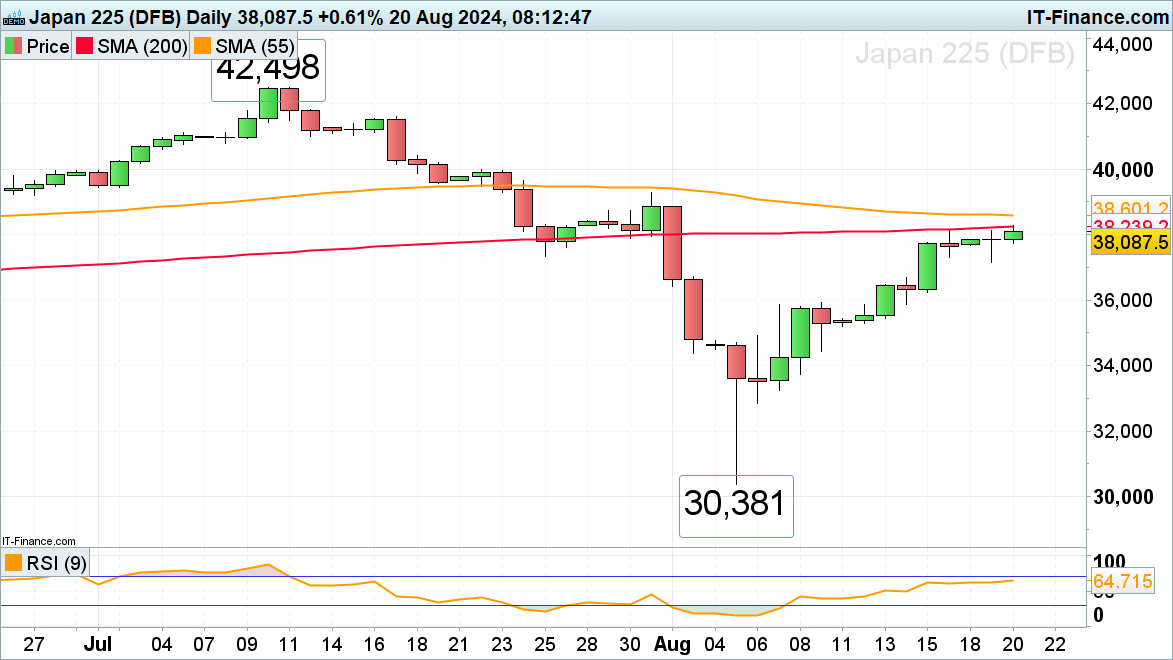
Following profit-taking on Monday, the Nikkei 225 regained its losses on Tuesday morning, helped by another strong showing of US indices. Last week’s high and the 200-day simple moving average (SMA) at 38,152-to-38,239 are currently being tested, slightly above which the 55-day simple moving average (SMA) can be spotted at 38,601. If overcome, the late July high at 39,280 would be next in line.
The short-term bullish bias is likely to remain in play while Monday’s low at 37,163 underpins.
Nikkei 225 Daily Chart
Dow Jones Industrial Average surges ahead
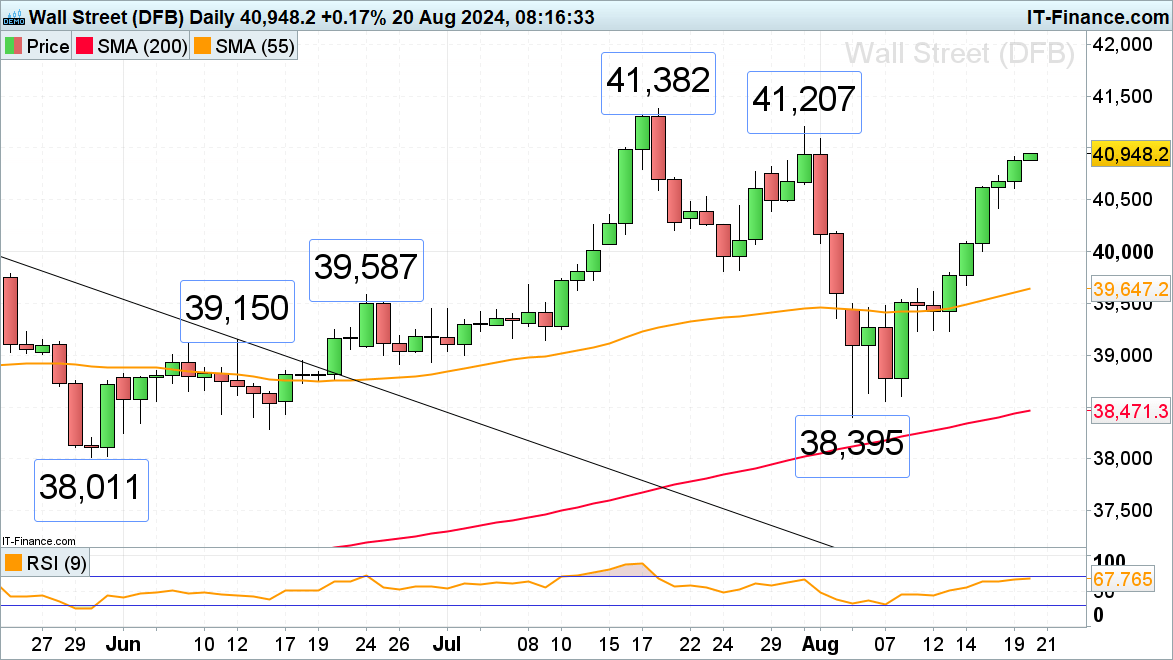
There seems to be no stopping the Dow from it being on track for its sixth consecutive day of gains whilst approaching its late July high at 41,207. Slightly further up sits the Dow’s all-time high at 41,382.
Immediate upside pressure should be maintained while Monday’s low at 40,606 holds.
Dow Jones Daily Chart
Nasdaq 100 continues its advance
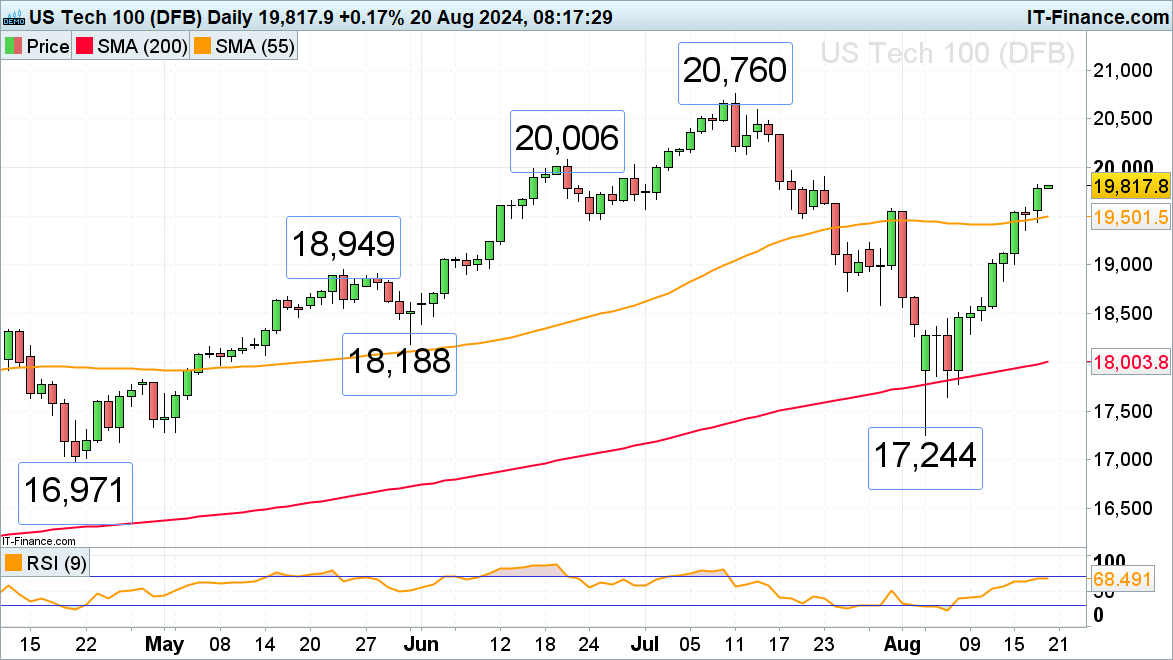
The Nasdaq 100 has not only risen above its 55-day simple moving average (SMA) at 19,501 but, more importantly, also above its late July peak at 19,577 with the late June high at 20,006 representing its next upside target.
Previous resistance, because of inverse polarity, should now act as support, that is to say the 19,577-to-19,501 area.
Nasdaq 100 Daily Chart
DailyFX provides forex news and technical analysis on the trends that influence the global currency markets.


