

US Dollar, Euro, Australian Dollar vs. Japanese Yen – Price Action:
- USD/JPY is flirting with the psychological 150 mark.
- EUR/JPY continues to be capped at key resistace; AUD/JPY is holding above key support.
- What is the outlook and what are the key levels to watch in select JPY crosses?
Looking for actionable trading ideas? Download our top trading opportunities guide packed with insightful tips for the fourth quarter!
USD/JPY: Fatigue, but no sign of reversal
USD/JPY’s rally has stalled recently as it hovers around stiff resistance at the psychological 150 mark, not too far from the 2022 high of 152.00. However, there is no sign of a reversal of the uptrend. The price action so far this month can be at best described as sideways with the lower edge beginning supported around the 200-period moving average, around the early-October low of 147.35.
USD/JPY 240-Minute Chart
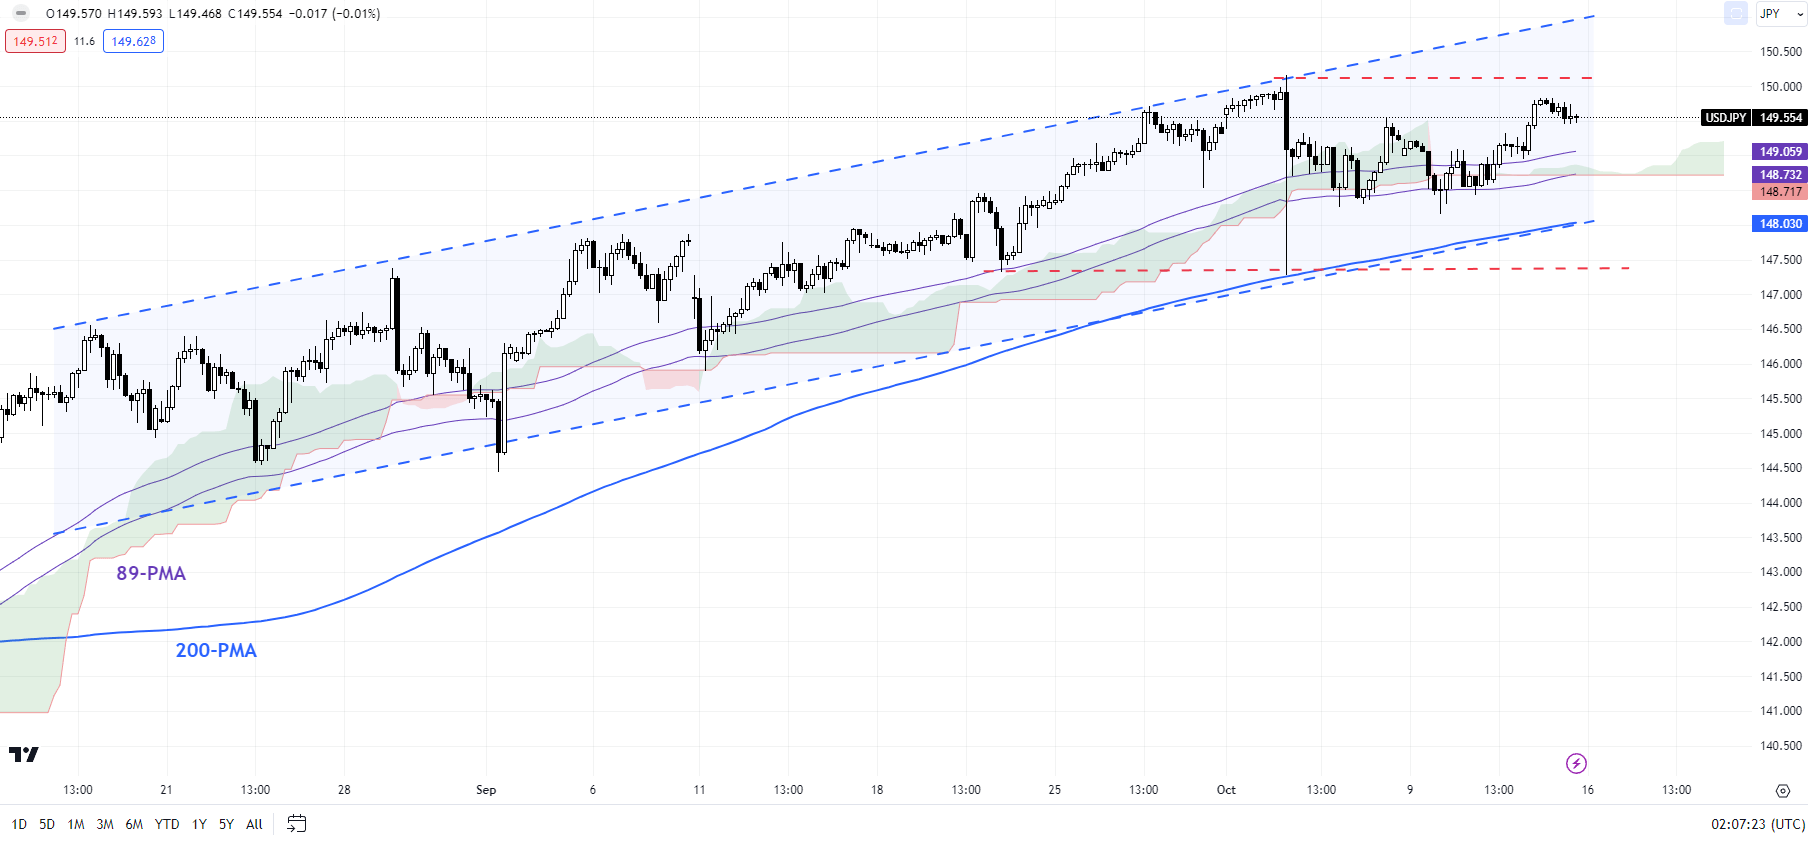
Chart Created by Manish Jaradi Using TradingView
With USD/JPY within last year’s intervention zone, it could be tough to clear 150.00-152.00, especially given some Fed officials have indicated a peak in rates. For more details on the fundamental outlook, see “Japanese Yen Aided by Fed Pause View, Geopolitics; USD/JPY, GBP/JPY, AUD/JPY,” published October 11. On the other hand, any fall below 147.00-147.50 would confirm that the broader upward pressure had faded. Such a fall could open the way toward the early-September low of 144.50.
EUR/JPY Daily Chart
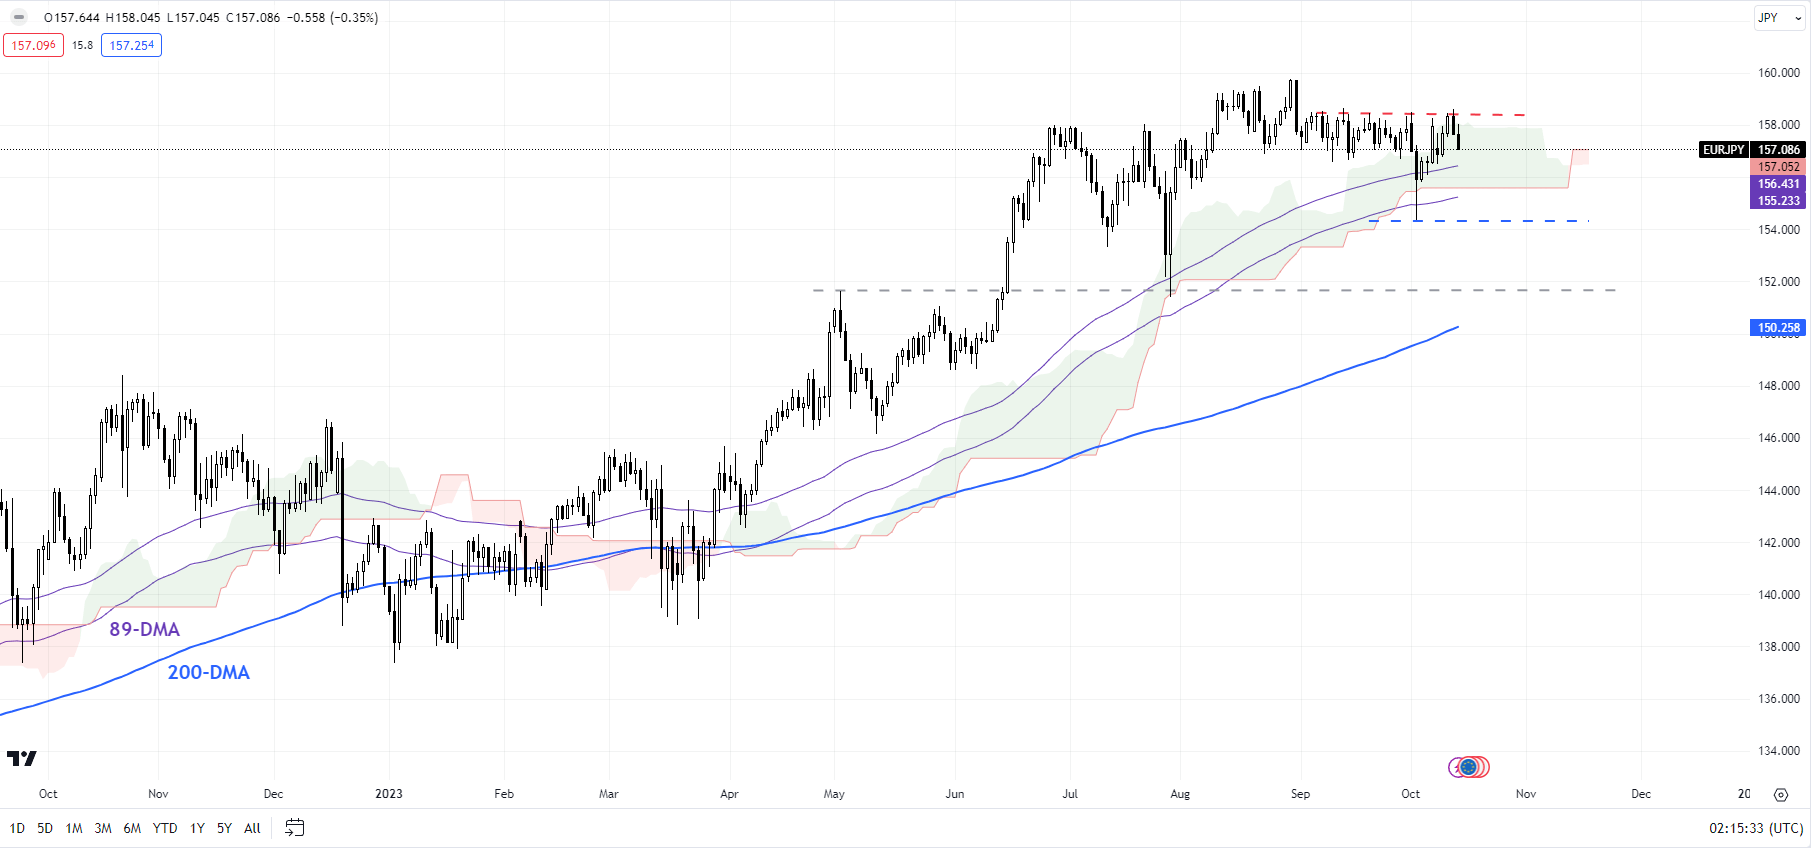
Chart Created by Manish Jaradi Using TradingView
EUR/JPY: Struggling to extend gains
EUR/JPY has been capped by quite strong resistance on a horizontal trendline since September (at about 158.50). Despite the recent sideways price action, the cross continues to hold above a vital cushion on the 89-day moving average, coinciding with the lower edge of the Ichimoku cloud on the daily charts, near the early-October low of 154.50. This support area is strong and could be tough to crack, especially in the context of the broader uptrend following the break earlier this year above strong resistance at the 2014 high of 149.75.
AUD/JPY Weekly Chart
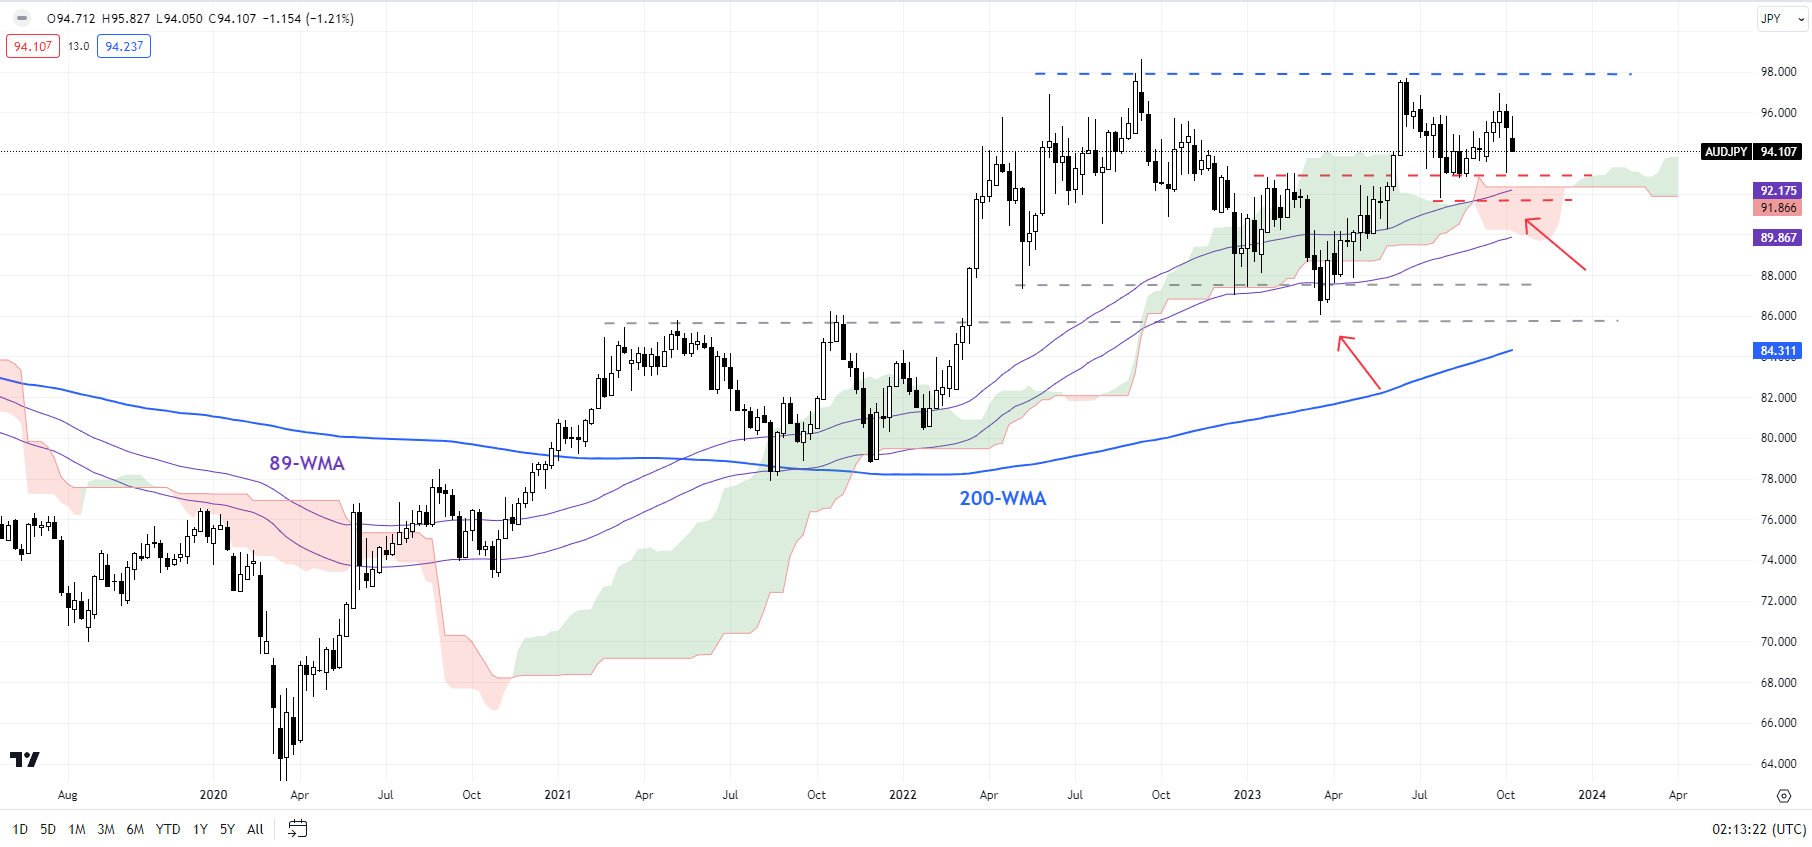
Chart Created by Manish Jaradi Using TradingView
AUD/JPY: Range likely
AUD/JPY has been unable to sustain gains recently, but while it continues to hold above quite strong converged support at the 89-day moving average, the February high, and the lower edge of the Ichimoku cloud on the daily charts, the broader bias continues to be up. At the same time, unless the cross clears the June high of 97.70 the path of least remains sideways at best.
Curious to learn how market positioning can affect asset prices? Our sentiment guide holds the insights—download it now!
— Written by Manish Jaradi, Strategist for DailyFX.com
— Contact and follow Jaradi on Twitter: @JaradiManish
DailyFX provides forex news and technical analysis on the trends that influence the global currency markets.