FTSE 100, DAX 40, S&P 500 Analysis and Charts
FTSE 100 in recovery mode
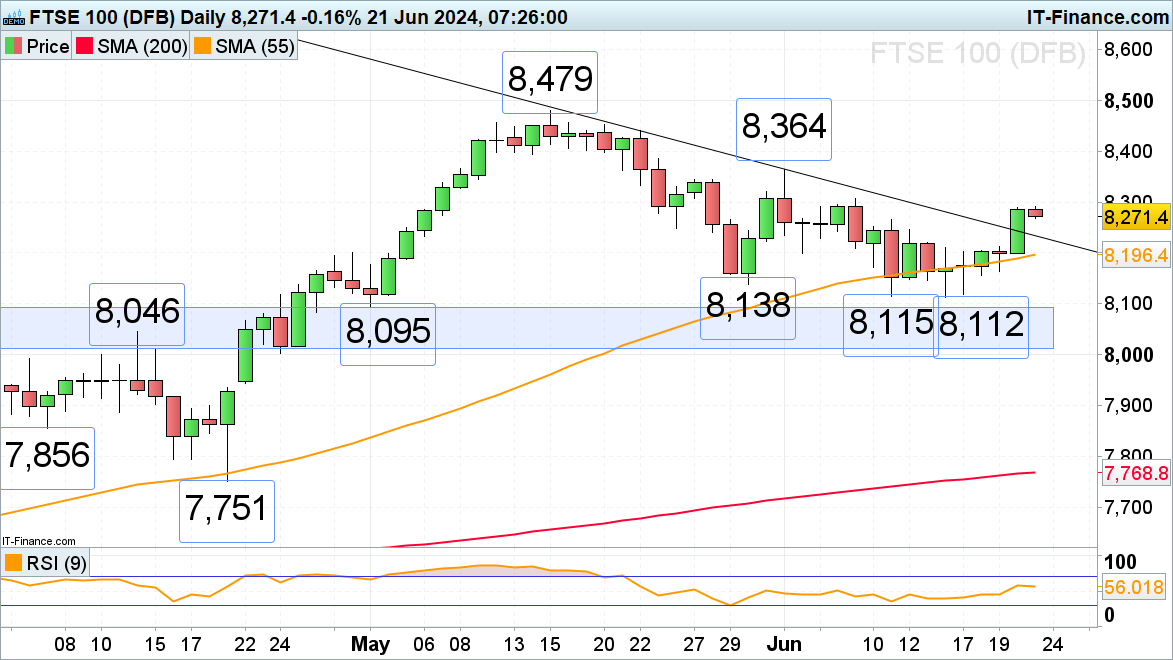
The FTSE 100 finally stopped oscillating around the 55-day simple moving average (SMA) at 8,196 and rallied above the May-to-June downtrend line at 8,234, which now because of inverse polarity, should act as support.
A rise above Thursday’s 8,289 high and the 7 June 8,306 high would put the early June high at 8,364 back on the plate.
FTSE 100 Daily Chart
Download your Free FTSE 100 Sentiment Guide
DAX 40 nears the 11 June 18,278 low
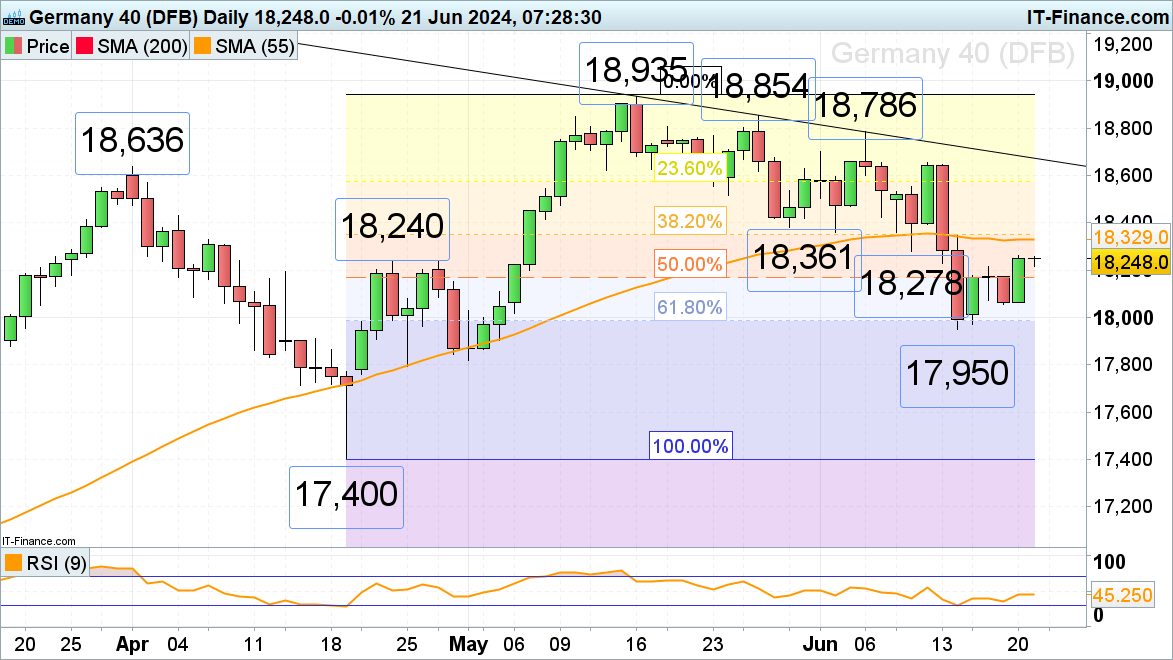
The DAX 40 has finally managed to rise from the 50% retracement of the April-to-May advance at 18,170 to a one-week high at 18,260. Above it meanders the 55-day simple moving average (SMA) at 18,329 and sits at the 18,361 early June low.
Minor support can be seen at Tuesday’s 18,213 high, ahead of the 50% retracement at 18,170.
DAX 40 Daily Chart
S&P 500 trades in record highs above the 5,500 mark
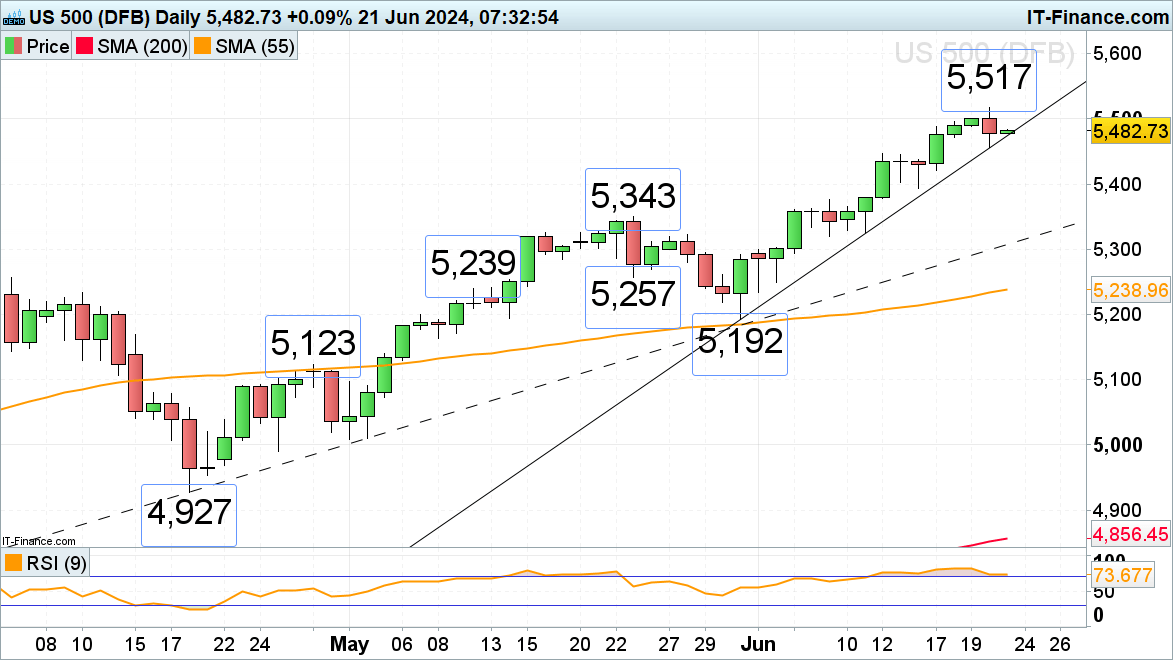
The S&P 500 trades in all-time highs around the 5,500 mark ahead of today’s US manufacturing and services PMI data. In case of a new record high being made, the 5,600 region would be in sight.
Were a slip through the May-to-June uptrend line at 5,474 to be seen, Thursday’s low at 5,456 would be in focus. If slipped through as well, a minor top may be formed with the mid-June 5,447 high and Monday’s 5,421 low being in sight.
S&P 500 Daily Chart
DailyFX provides forex news and technical analysis on the trends that influence the global currency markets.


