FTSE 100, DAX 40, S&P500 Analysis and Charts
FTSE 100 recovers from Tuesday’s sell-off
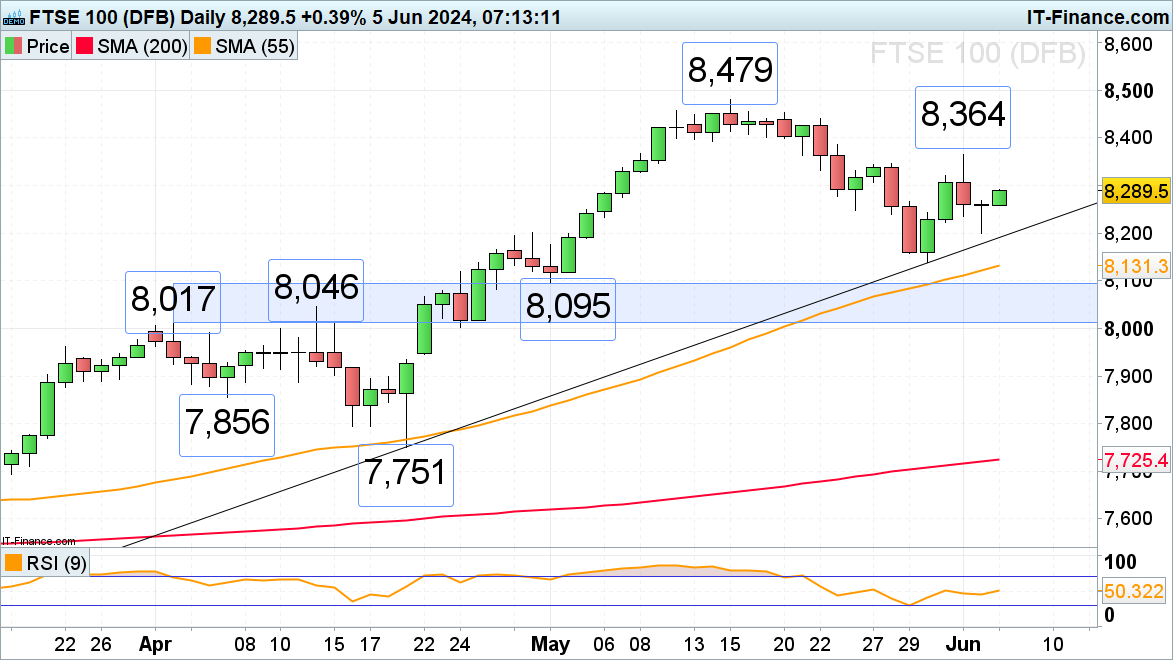
The FTSE 100 formed a potentially bullish hammer formation on Tuesday. It will be confirmed if a daily chart close will be made above Tuesday’s high at 8,268 on Tuesday. As long as Tuesday’s low and the April-to-June uptrend line at 8,199 to 8,192 underpin, Monday’s high at 8,364 will be back in the picture.
FTSE 100 Daily Chart
DAX 40 bounces off Tuesday’s low
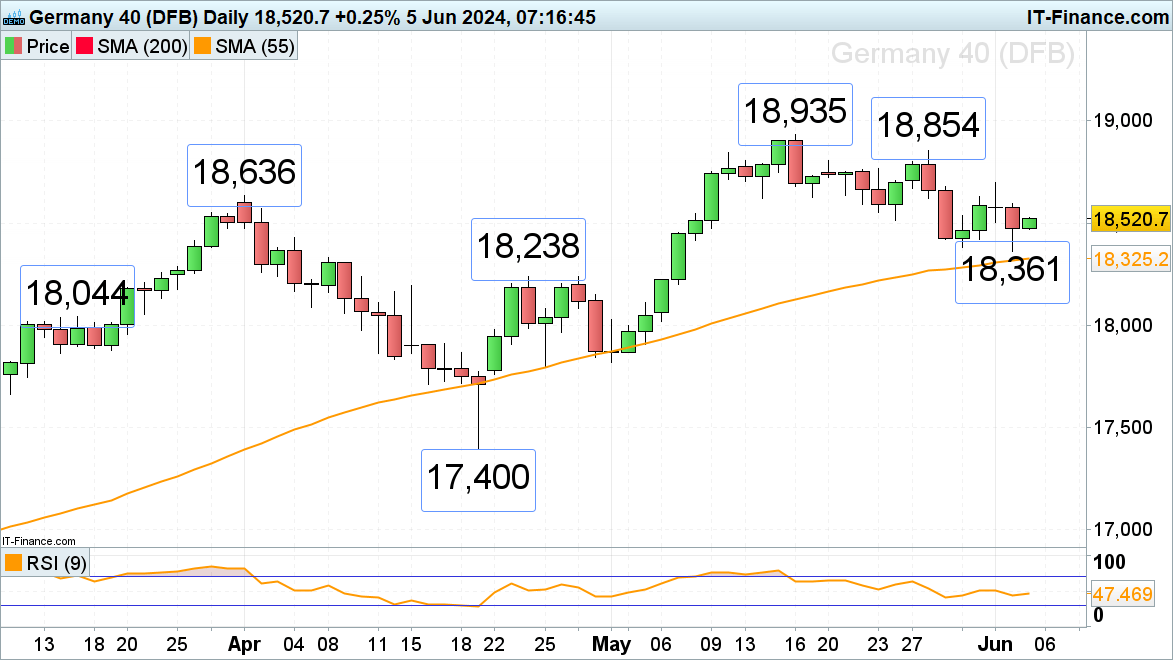
The DAX 40 revisited last week’s low and dropped to 18,361 before regaining some of its losses on Tuesday. A rise above Tuesday’s high at 18,594 is needed, for Monday’s peak at 18,700 to be back in focus.
Failure at this week’s low and the 55-day simple moving average (SMA) at 18,361 to 18,325 would put the late April high at 18,238 on the map.
DAX 40 Daily Chart
S&P 500 continues to bounce off last week’s low
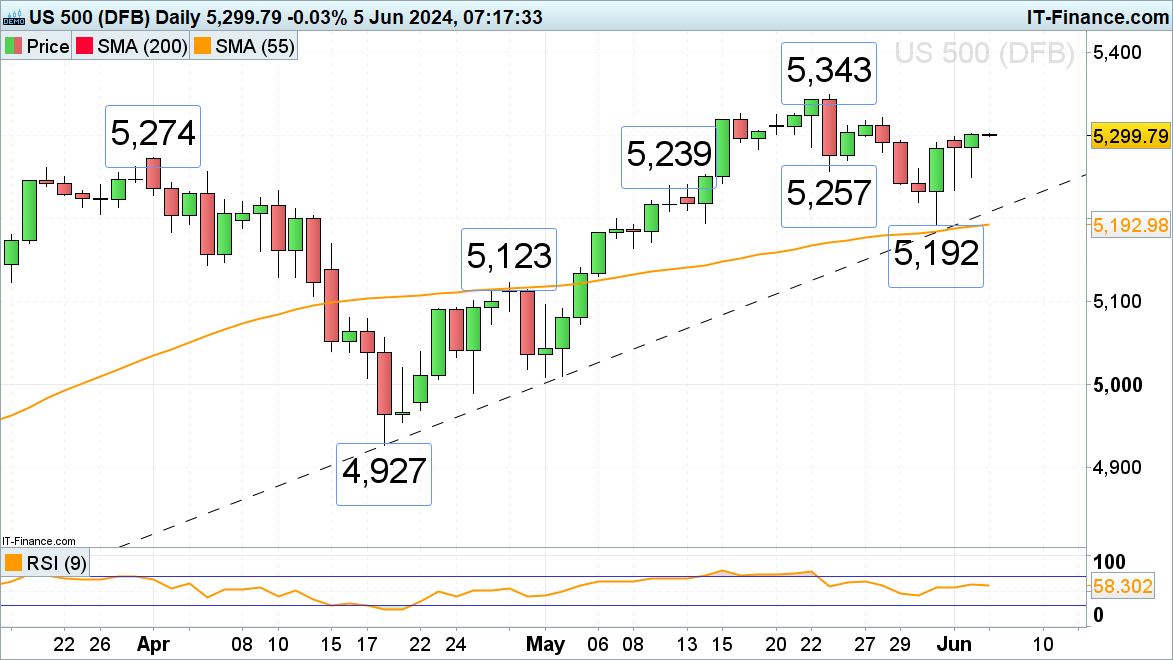
The S&P 500’s corrective move lower from its May record high at 5,343 to Friday’s 5,192 low probably ended at last week’s low as it appears to be an Elliott wave abc zig zag correction which should be followed by an advance to new all-time highs. First in line is the 28 May high at 5,321. The medium-term uptrend will remain intact while the late May low at 5,192 underpins.
Minor support can be spotted at the 30 May high at 5,260 and the 23 May low at 5,257.
S&P 500 Daily Chart
DailyFX provides forex news and technical analysis on the trends that influence the global currency markets.


