FTSE 100 is taking a breather
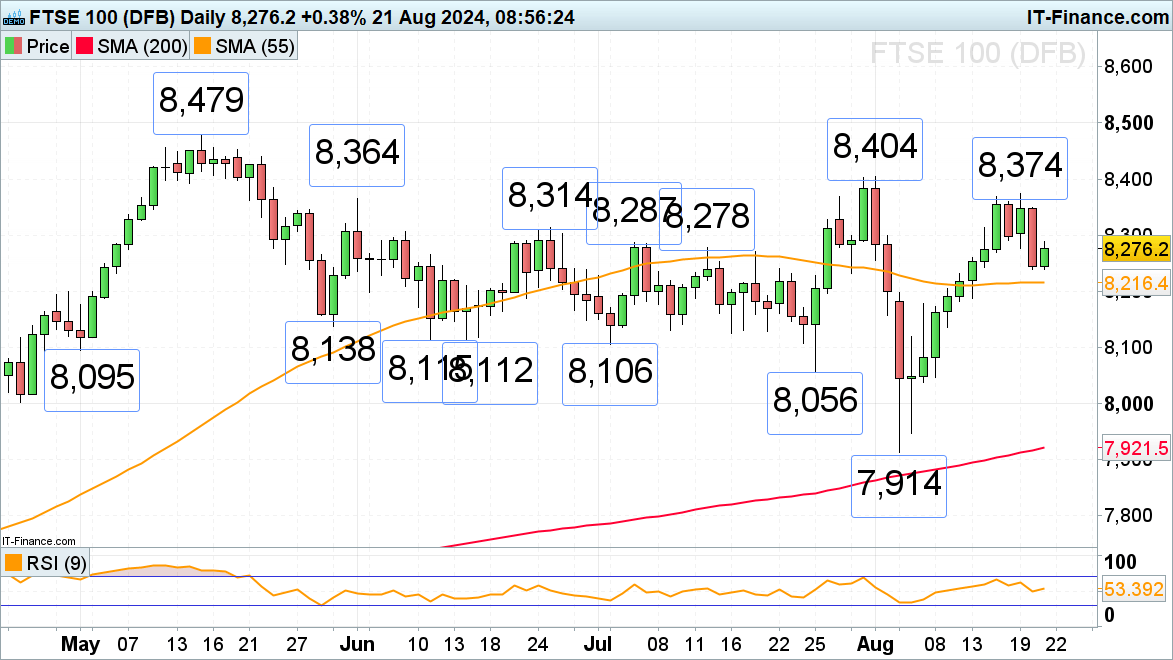
After a near two-week buying frenzy in the FTSE 100, this week has seen some profit taking in the index ahead of US FOMC minutes and the Jackson Hole symposium which may shed more light on US monetary policy. The 55-day simple moving average (SMA) at 8,216 may thus be revisited this week, below which lies a significant support zone between the late May to early July lows at 8,138-to-8,106. Key resistance remains to be seen at the early August high and this week’s peak at 8,374-to-8,404.
FTSE 100 Daily Chart
DAX 40 rally is losing upside momentum
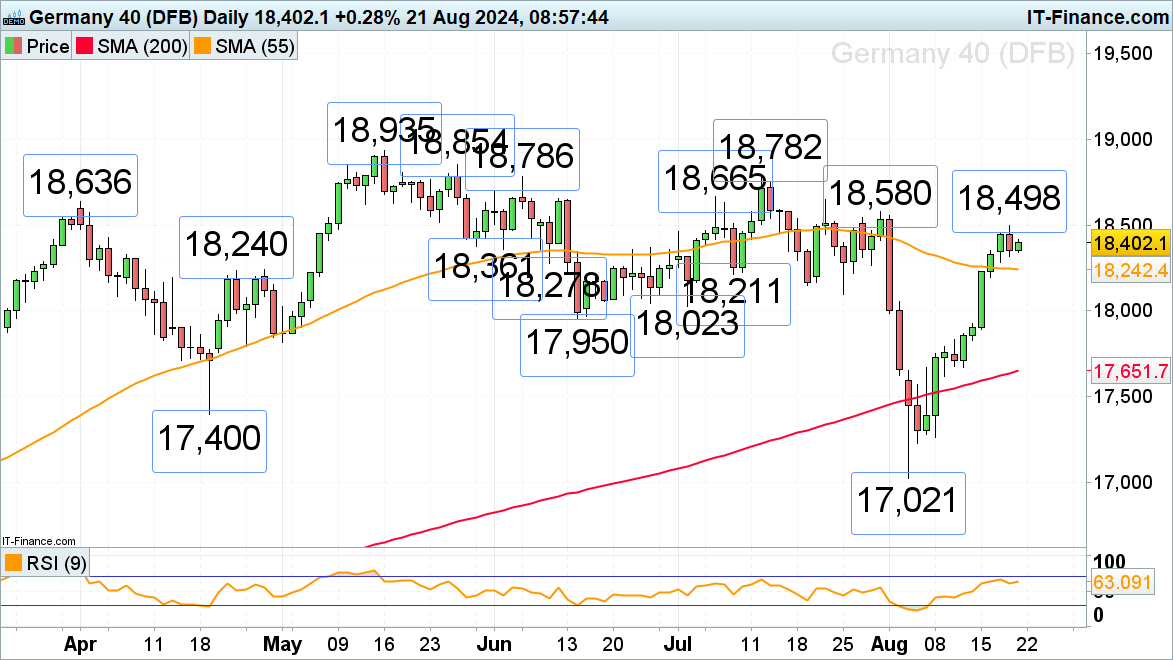
The DAX 40’s swift recovery from its early August 17,021 low has taken it close to its late July high at 18,580 by so far rising to 18,498 on Tuesday before profit taking kicked in. Minor support can be seen along the 55-day simple moving average (SMA) at 18,242 ahead of the 9 July low at 18,211.
DAX 40 Daily Chart
S&P 500 advance stalls ahead of July FOMC minutes publication
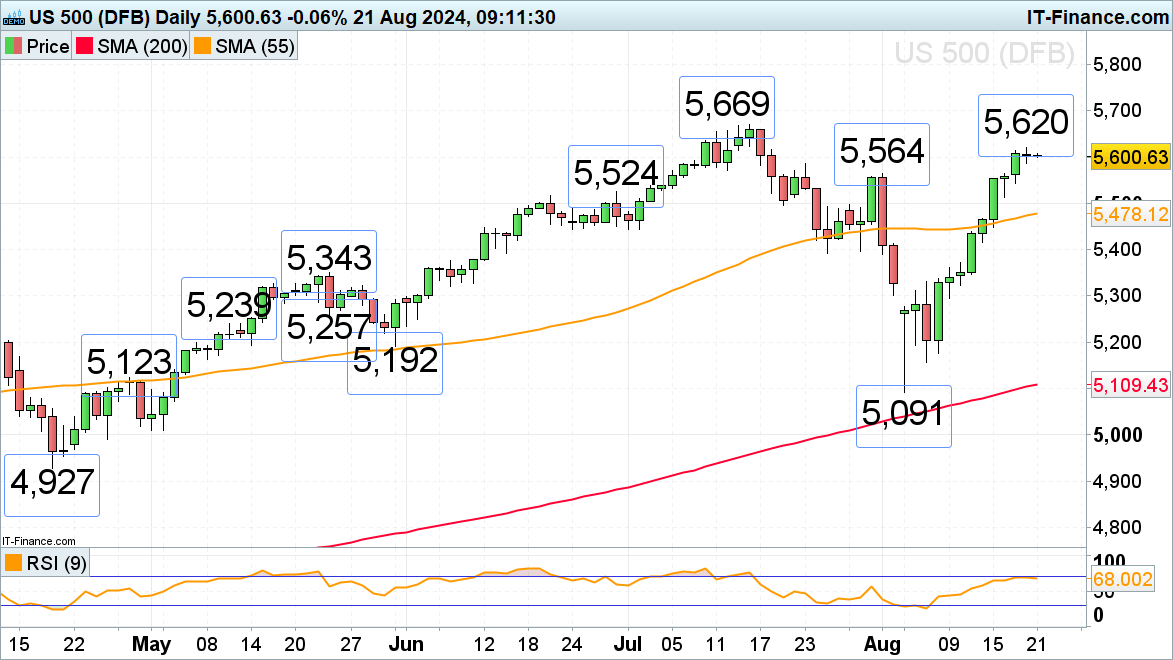
The S&P 500’s swift rally from its 5 August low at 5,091 ended a day short of matching a 20-year-old winning streak by rising to Tuesday’s 5,620 high before retracing slightly lower. A rise above this level would engage its July 5,669 record high. Potential slips may find support around the early August high at 5,564.
S&P 500 Daily Chart
DailyFX provides forex news and technical analysis on the trends that influence the global currency markets.


