FTSE 100, DAX 40, CAC 40 – Analysis and Charts
FTSE 100 remains side-lined
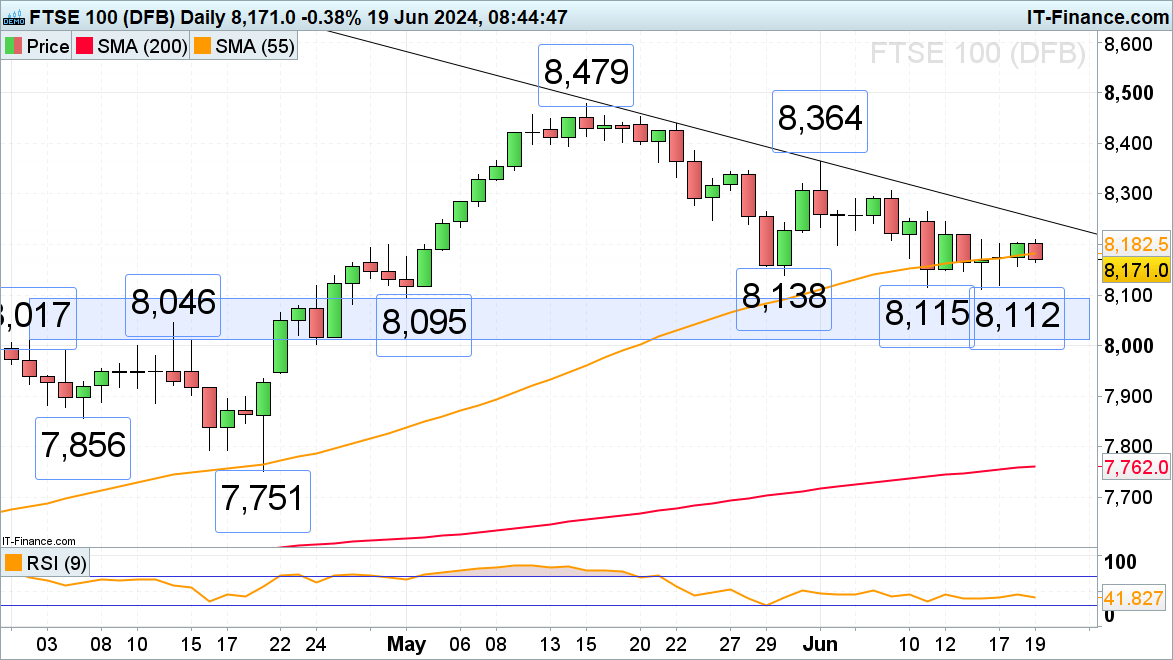
The FTSE 100 continues to oscillate around the 55-day simple moving average (SMA) at 8,182 with Thursday’s high at 8,220 representing a possible short-term upside target.
A fall through Tuesday’s low at 8,157 would put the current June lows at 8,115 to 8,112 on the cards. If fallen through, the 8,095 to 8,017 early and mid-April highs and late May low would probably be targeted.
For the bulls to be back in control, a rise above last Tuesday’s high at 8,266 would need to occur.
FTSE 100 Daily Chart
DAX 40 comes off 50% retracement
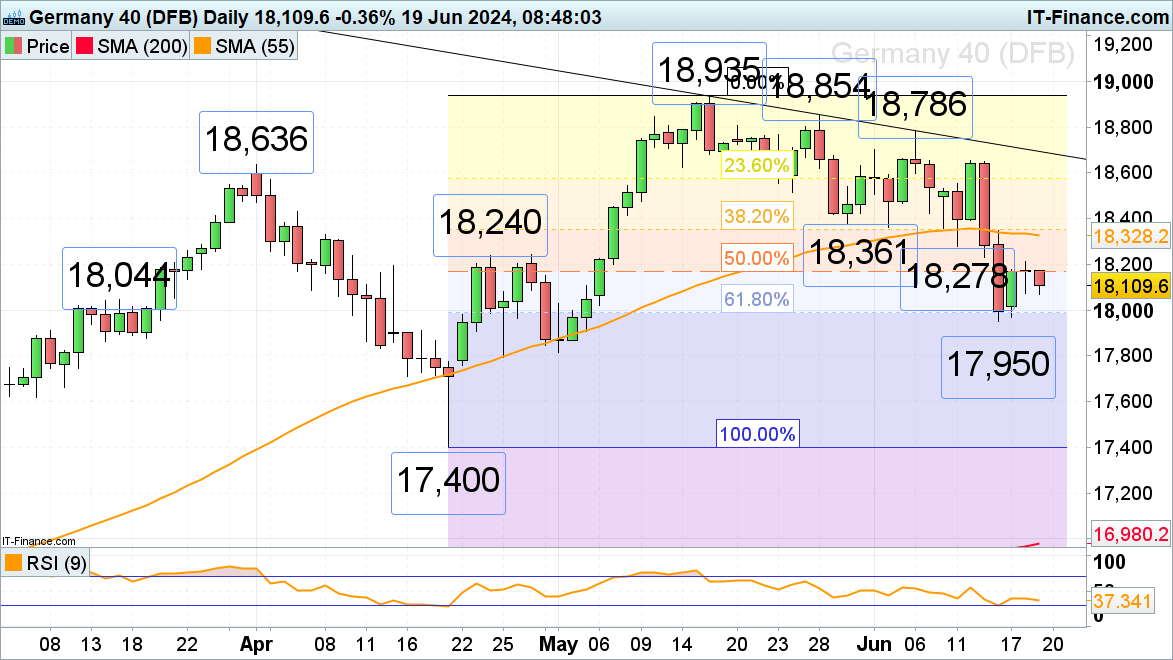
The DAX 40 is finding it difficult to overcome the 50% retracement of the April-to-May advance at 18,170. Tuesday’s high, for example, was made at 18,213 before a Doji was formed. It denotes indecision with little trading volume likely to go through today as US markets are shut for the Juneteenth holiday.
Below Tuesday’s and today’s intraday lows at 18,070 to 18,068 lies the 61.8% Fibonacci retracement of the April-to-May advance at 17,988 and the current June low at 17,950.
Only a rise above the 18,213 high would put the 18,240 late April high and the 55-day simple moving average (SMA) at 18,328 on the map.
DAX 40 Daily Chart
CAC 40 finds it hard to recover from its 4 ½ month low
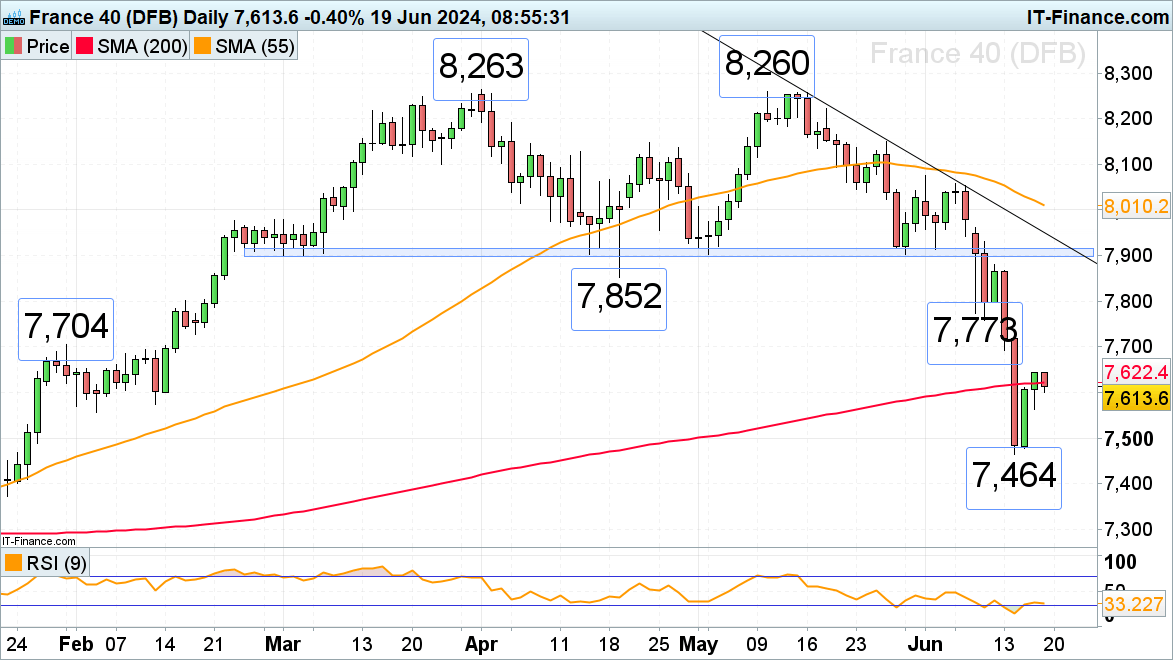
The French CAC 40 index is finding it difficult to recover from last week’s sharp 5% loss and is trading along the 200-day simple moving average (SMA) at 7,622. A rise above Tuesday’s high at 7,644 is needed, for the 7,704 late January high to be next in line.
Minor support can be spotted at Tuesday’s 7,563 low, below that lies last week’s low at 7,464. Were a fall through 7,464 to ensue, the December peak at 7,653 may offer support. If not, a drop toward the 7,281 January trough may be in the frame.
CAC 40 Daily Chart
DailyFX provides forex news and technical analysis on the trends that influence the global currency markets.


