DAX 40, CAC 40, FTSE 100 Analysis and Charts
FTSE 100 slips alongside its European peers
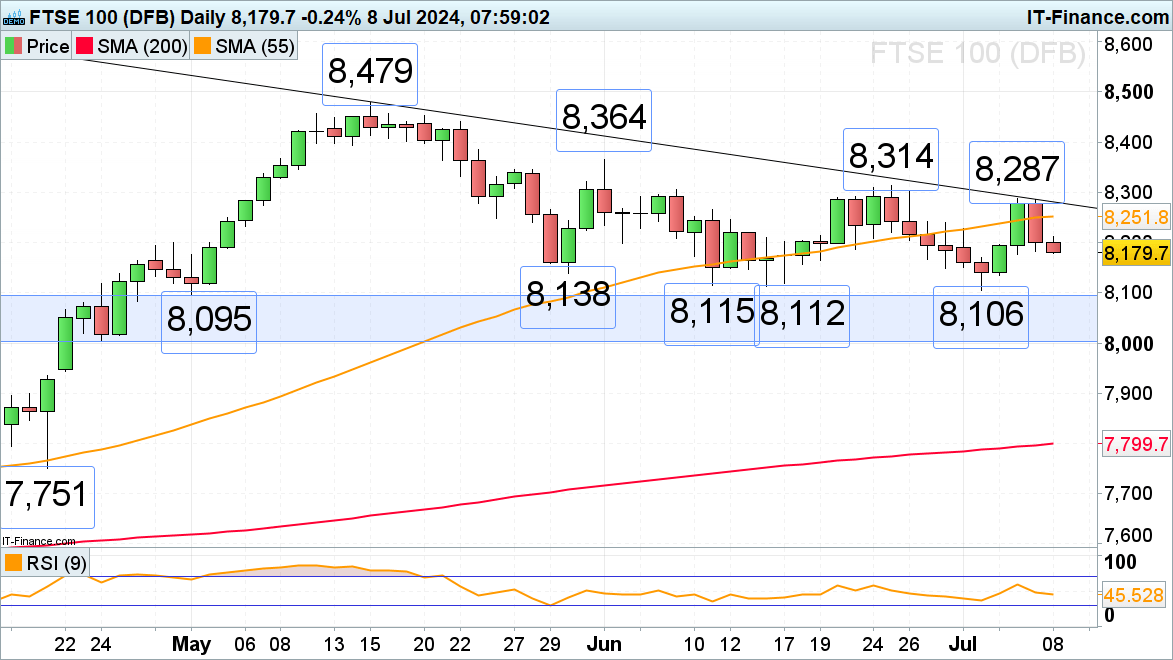
The FTSE 100 has once more been rejected by its May-to-July downtrend line at 8,287 and kicks off the week in the red as Asian and European markets slump amid the French election result ahead of US and China inflation data. The late May low at 8,138 may be revisited, a fall through which would open the way for the major 8,115-to-8,106 June-to-July lows to be retested.
Minor resistance is seen along the 55-day simple moving average (SMA) at 8,252, the May-to-July downtrend line at 8,280, and last week’s 8,287 high.
FTSE 100 Daily Chart
DAX 40 stall below two-week high
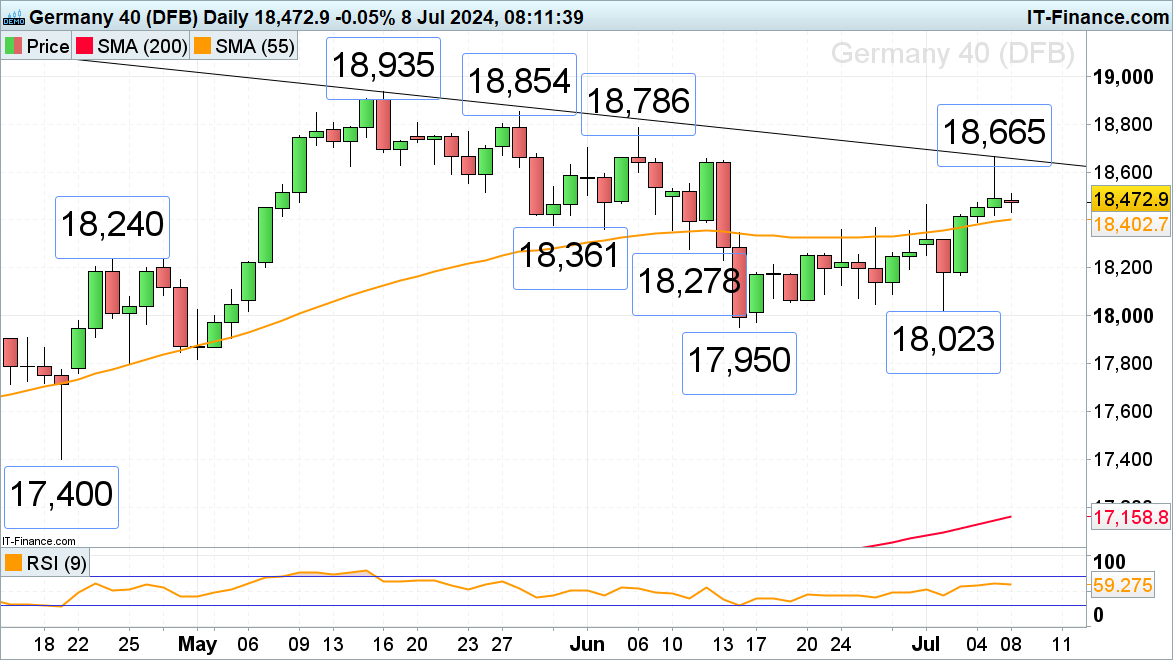
The DAX 40’s rally to Friday’s 18,665 high has been followed by a slip towards Friday’s low at 18,420 and the 55-day simple moving average (SMA) at 18,403 as the outcome of the French election points to political uncertainty. Further minor support can be spotted between the early June low at 18,361 and the 24 and 26 June highs at 18,367-to-18,357.
Only a currently unexpected advance through the May-to-July downtrend line at 18,658 and above last week’s high at 18,665 would push the 18,786 to 18,935 May-to-June peaks to the fore.
DAX 40 Daily Chart
CAC 40 slides as post-French election uncertainty rattles investors
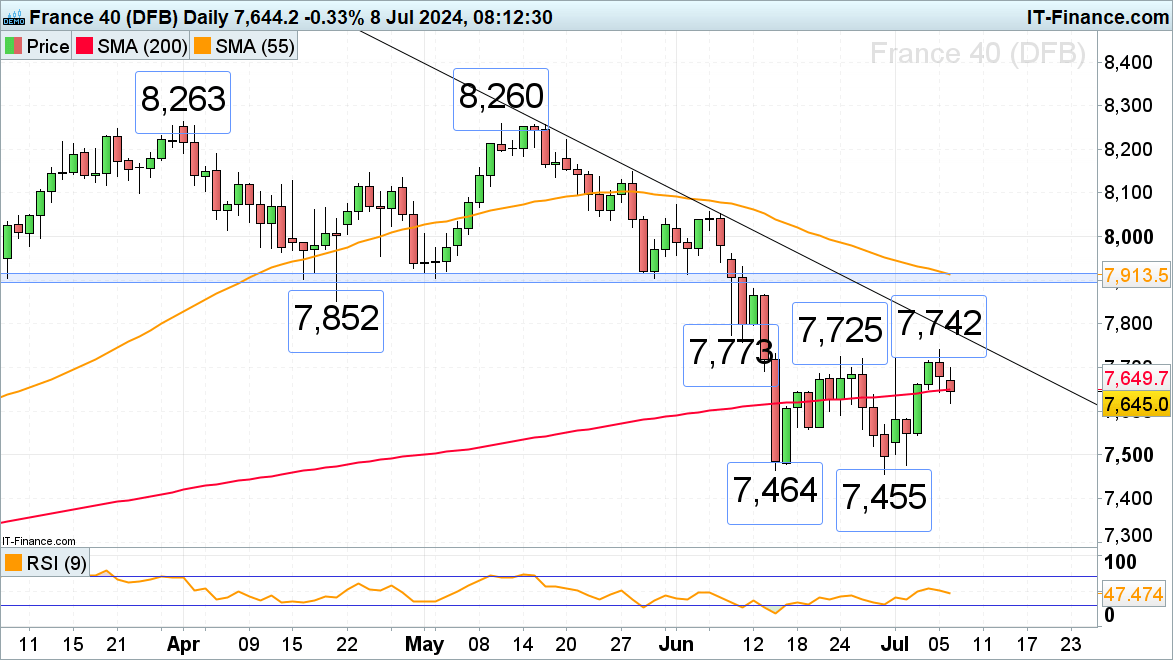
The French CAC 40, which on Friday flirted with its 24 June high at 7,725 and briefly rose to a 3-week high at 7,742, so far dropped to below the 200-day simple moving average (SMA) at 7,650, to Monday’s intraday low at 7,617. While the major French stock index stays above its mid-to-late-June lows at 7,464-to-7,455 but trades below Friday’s 7,742 high, further sideways trading remains in store. A break out of this trading range will likely determine the next medium-term trend.
A rise and daily chart close above Friday’s 7,742 high would confirm a double bottom chart formation and put the April low at 7,852 on the cards, as well as the 55-day simple moving average (SMA) at 7,914 and the psychological 8,000 mark.
Only a fall through the 7,455 June low could provoke a slide towards the January low at 7,281 and perhaps even lead to the 7,000 region being revisited.
CAC 40 Daily Chart
DailyFX provides forex news and technical analysis on the trends that influence the global currency markets.


