FTSE 100 may stall after six straight days of gains
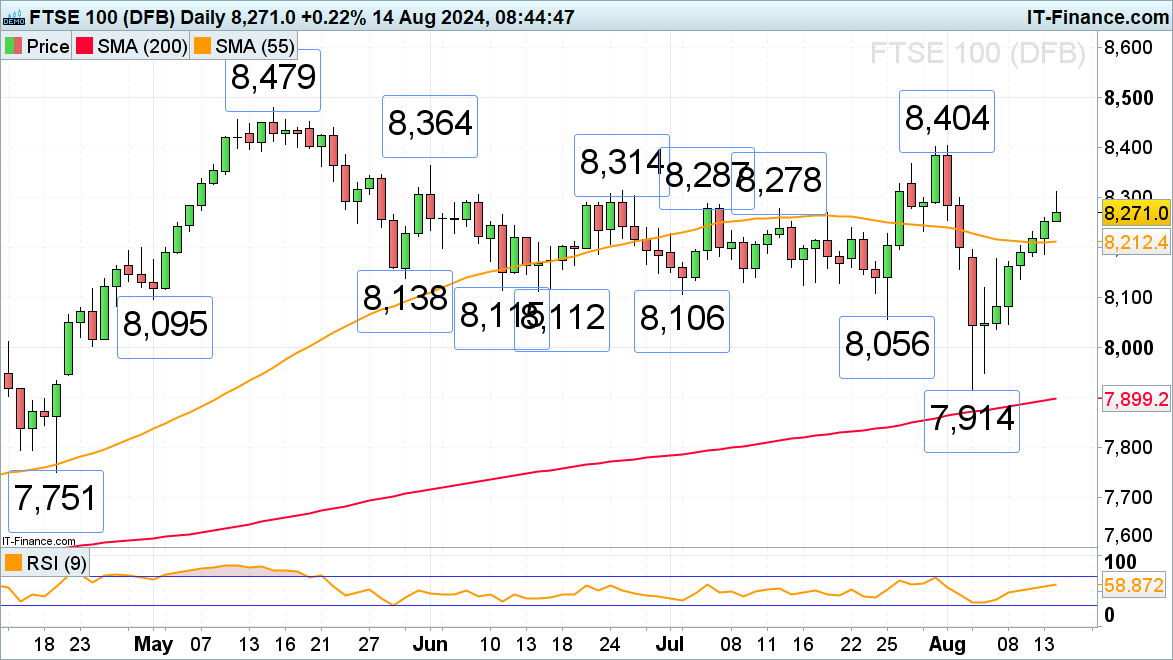
The FTSE 100 is on track for its seventh straight day of gains but is expected to stall within its 8,278-to-8,314 late June to mid-July highs and thus resistance area. Were it to be overcome, though, the early August high at 8,404 would be back in the frame.
Minor support can be seen along the 55-day simple moving average (SMA) at 8,212.
FTSE 100 Daily Chart
DAX 40 loses upside momentum near resistance
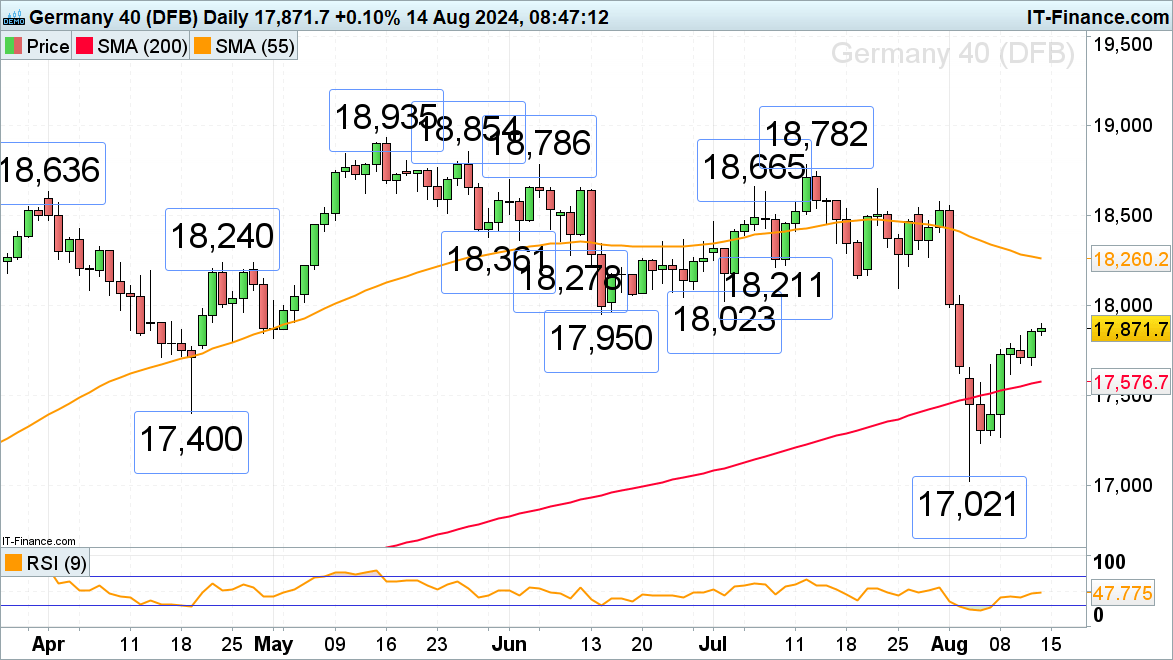
The DAX 40’s recovery from last week’s 17,021 low is losing upside momentum below its 17,950 mid-June low. This level, together with the 18,023 early July low, is expected to act as resistance.
A slip through Tuesday’s low at 17,669 would engage the 55-day simple moving average (SMA) at 17,577.
DAX 40 Daily Chart
S&P 500 advance may stall after four consecutive days of gains
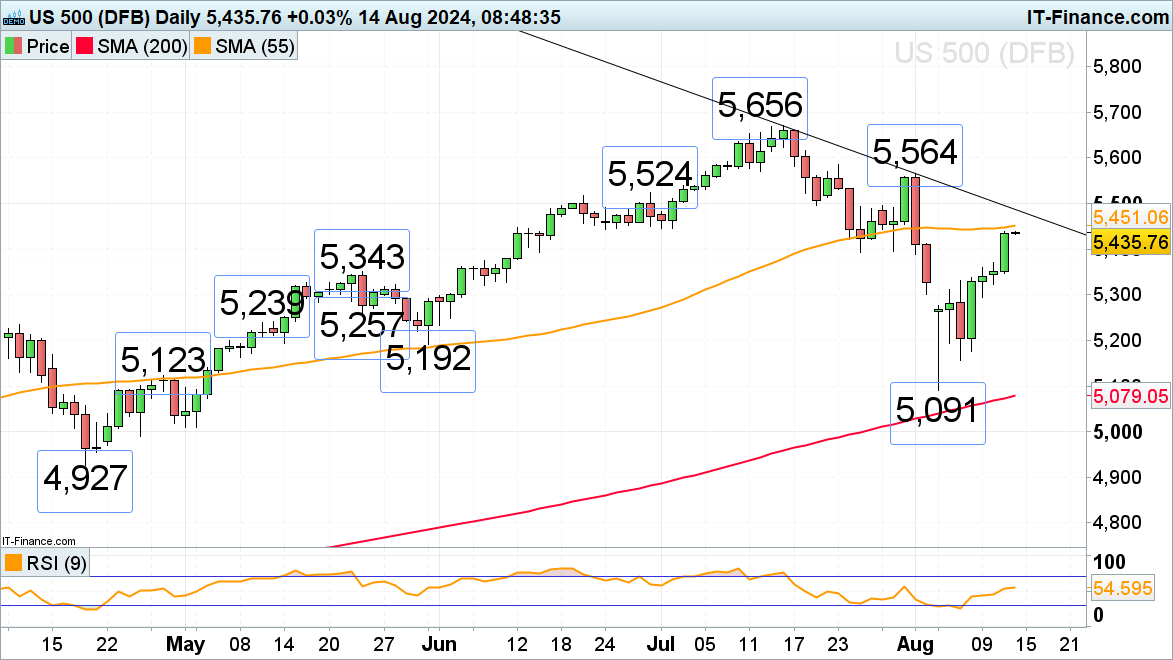
The S&P 500 is getting ever closer to its 55-day simple moving average (SMA) at 5,451 which, together with the July-to-August downtrend line at 5,485, is likely to act as resistance this week.
Minor support can be found between the 25 and 30 July lows at 5,396-to-5,392.
S&P 500 Daily Chart
DailyFX provides forex news and technical analysis on the trends that influence the global currency markets.


