

Bitcoin, BTC/USD, Ethereum, ETH/USD – Outlook:
- Bitcoin and Ethereum have cleared above minor resistance.
- Important for BTC/USD and ETH/USD to sustain gains if the rebound is for real.
- What is the outlook and what are the key levels to watch?
Elevate your trading skills and gain a competitive edge in trading cryptocurrencies. Download the free guide!
Cryptocurrencies have surged on hopes that the US could soon approve a bitcoin exchange-traded fund. Technical charts suggest there is room for further rise.
BITCOIN: Cracks above the key barrier
Bitcoin has broken above a crucial hurdle at the July high of 31800, triggering a double bottom (the June and September 2023 lows), potentially opening the way toward 39,000. The surge in momentum follows a rise above another vital barrier on the 200-day moving average, roughly coinciding with the end-August high of 28150. The move on the daily charts coincides with a rise out of the bearish Ichimoku cloud on the weekly charts – BTC/USD was last above the cloud back in 2021.
BTC/USD Weekly Chart
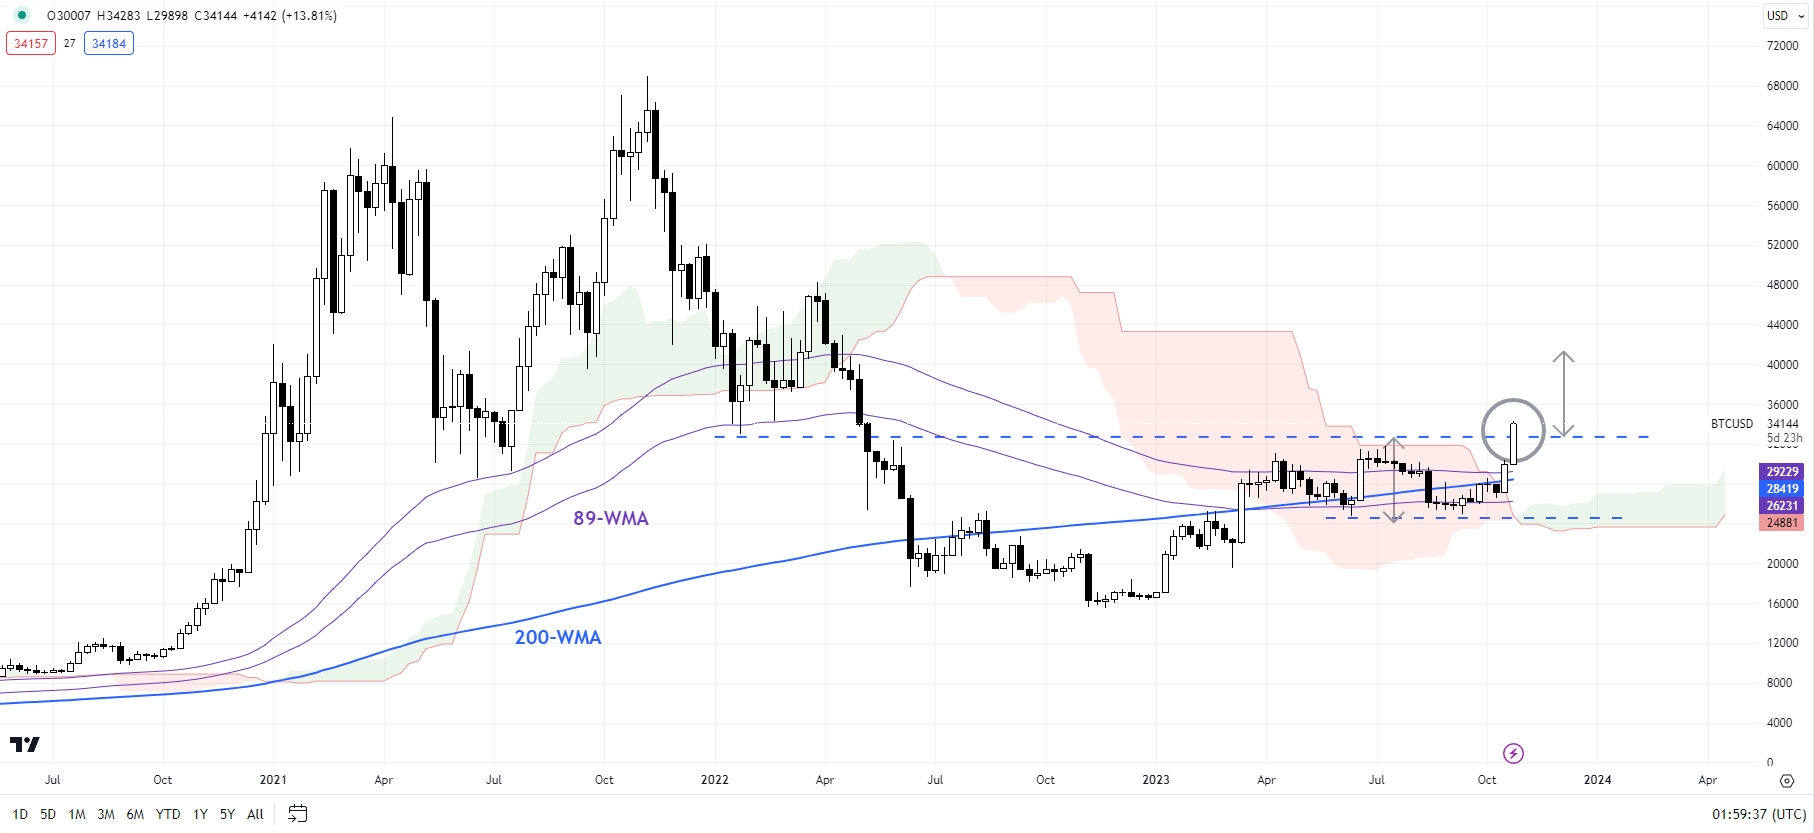
Chart Created by Manish Jaradi Using TradingView
Signs of upward momentum emerged last month after a rebound from strong support at the June low of 24750, which kept intact the higher-top-higher-bottom formation since the end of 2022. Importantly, this keeps alive the possibility of an extended recovery given the 2021-2022 decline, reinforcing the bullish medium-term trajectory, first highlighted earlier this year – see “Bitcoin Technical Outlook: BTC/USD Turns Bullish”, published January 18.
BTC/USD Daily Chart
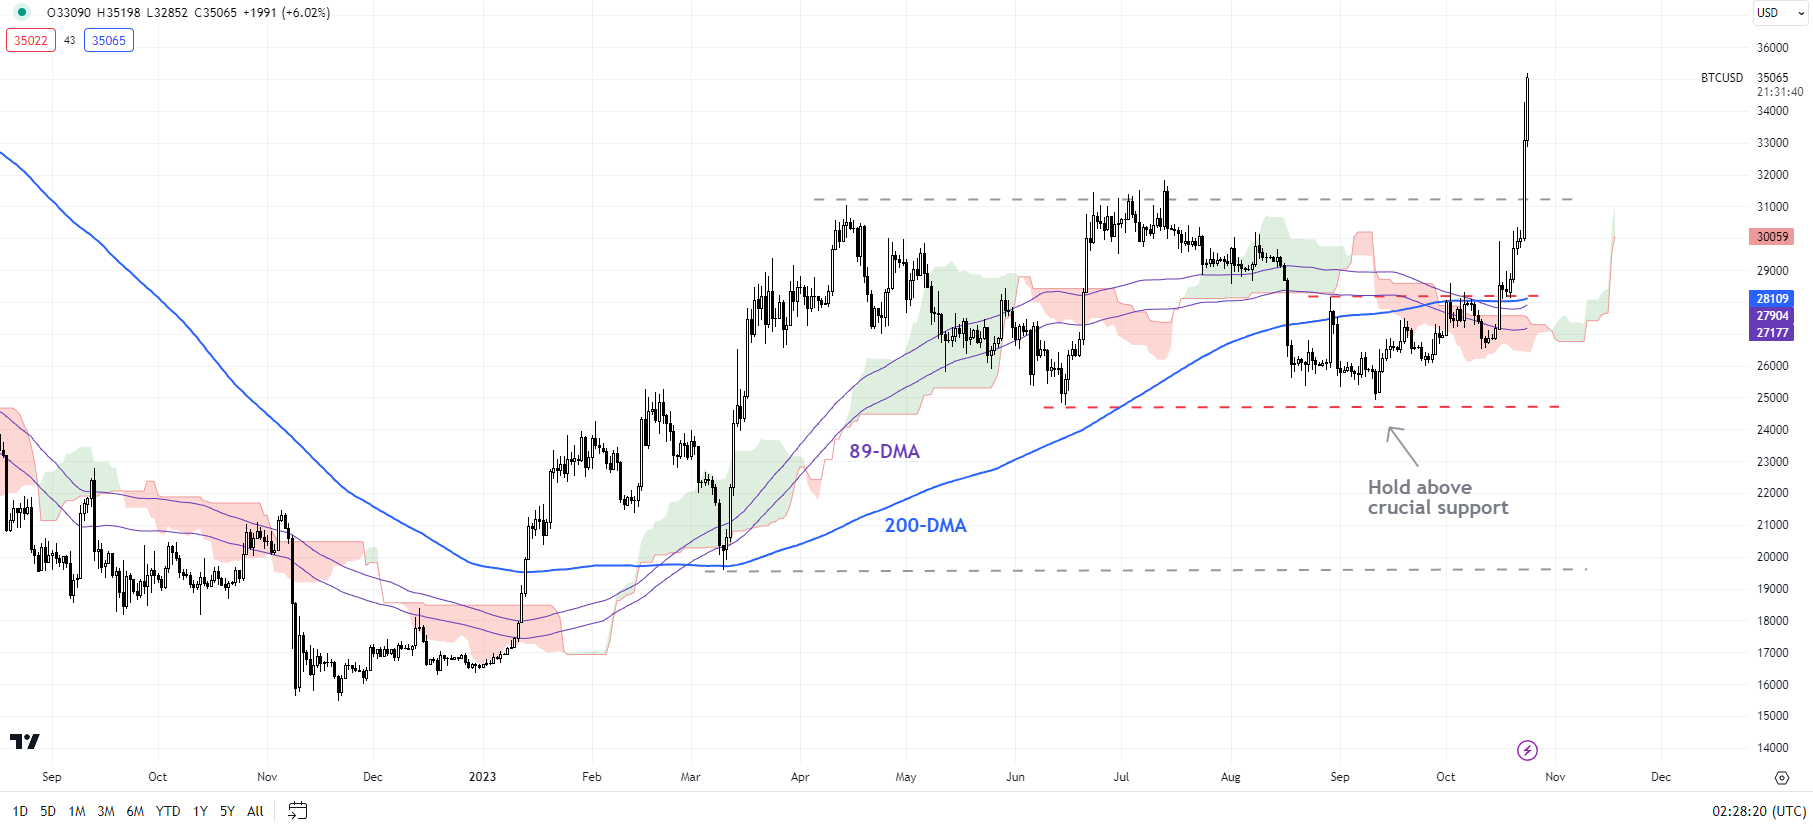
Chart Created by Manish Jaradi Using TradingView
Dips could be limited for now, with immediate support on the 10-hour moving average (now at about 33,000), and stronger support on the 30-hour moving average (now at about 31600).
ETHEREUM: Holds above vital support
Ethereum has been attempting to break above a key hurdle on the upper edge of a sideways channel since August (that comes in at about 1745). A decisive break above could open the door toward 1970, the price objective of the pattern.
ETH/USD Weekly Chart
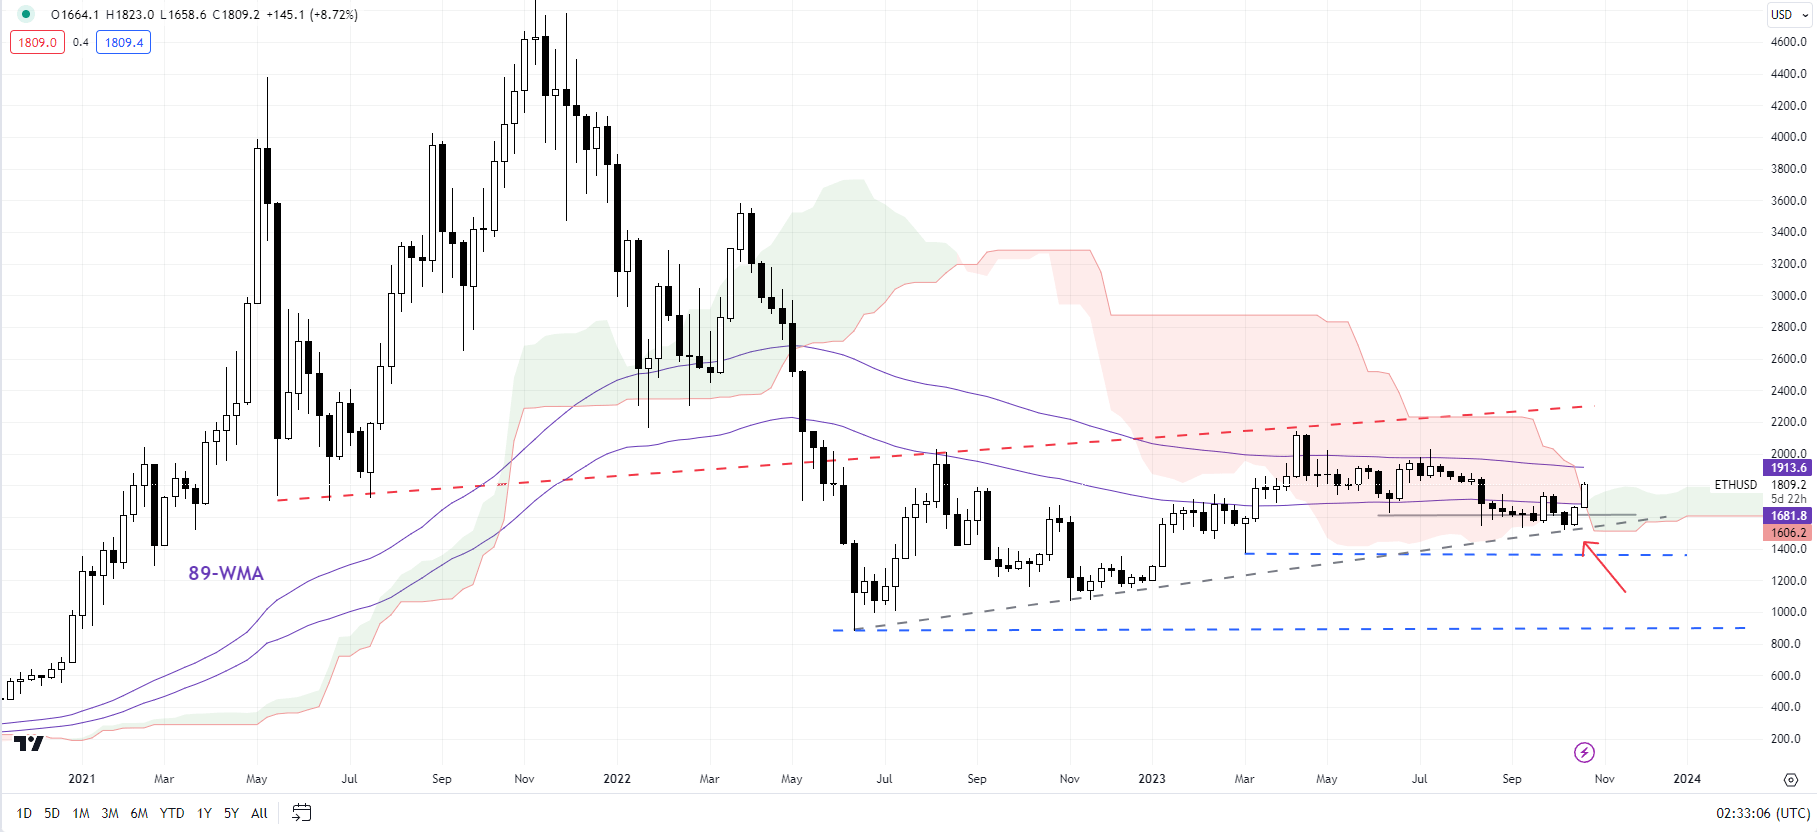
Chart Created by Manish Jaradi Using TradingView
The bullish momentum started after ETH/USD hit a key cushion on the lower edge of the channel at about 1550, not too far from the lower edge of a downtrend channel since April. On the weekly charts, ETH/USD has held above the 200-week moving average, an uptrend line from last year, around the lower edge of the Ichimoku cloud.
ETH/USD Daily Chart
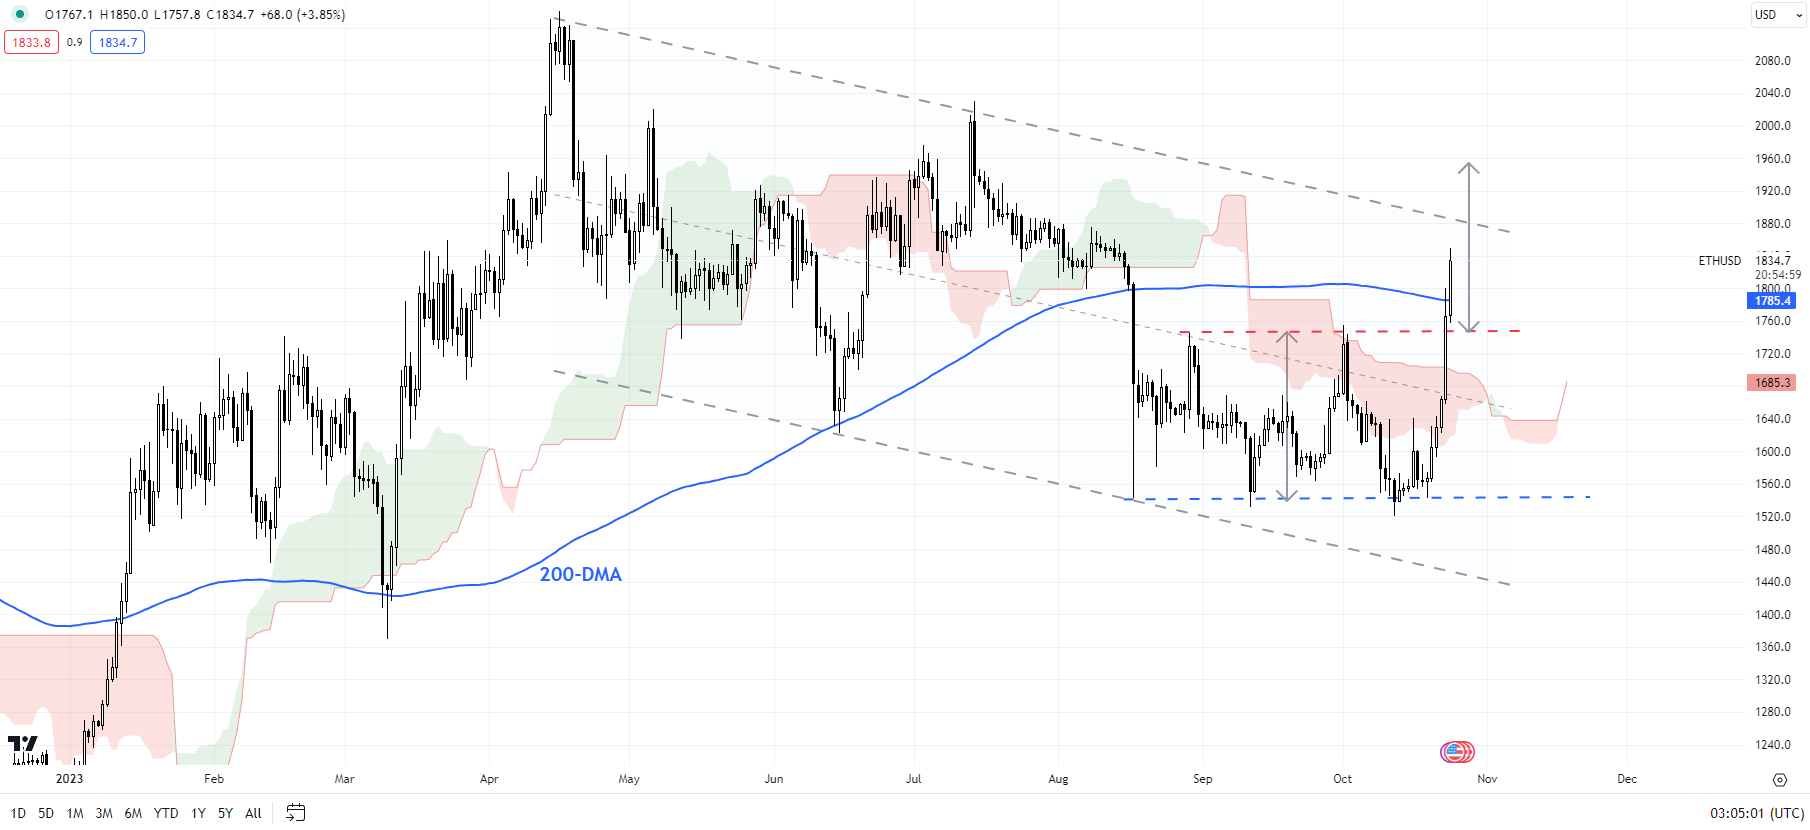
Chart Created by Manish Jaradi Using TradingView
Having said that, for the recovery to continue, ETH/USD would eventually need to cross above the April high of 2145, raising the odds of an extended rebound toward 2400 (the 38.2% retracement of the 2021-2022 decline).
Curious to learn how market positioning can affect asset prices? Our sentiment guide holds the insights—download it now!
— Written by Manish Jaradi, Strategist for DailyFX.com
— Contact and follow Jaradi on Twitter: @JaradiManish
DailyFX provides forex news and technical analysis on the trends that influence the global currency markets.