Japanese Yen (USD/JPY) Analysis and Charts
- USD/JPY has ticked up for a second straight session
- However it remains confined to its broad trading range
- The Fed isn’t expected to move on rates, but will it push back market views of when it might?
Learn How to Trade USD/JPY with our Free Guide
The Japanese Yen is a little weaker against a United States Dollar benefitting from some general strength as markets await the Federal Reserve’s first interest-rate call of the year.
That will be coming up after European markets wind down on Wednesday, at 1900 GMT. The US central bank isn’t expected to alter borrowing costs this time around. However, the markets still expect some pretty deep reductions this year, and the extent to which Fed commentary confirms that thesis is likely to be the main point of this Open Market Committee meeting for traders and economists alike.
One major concern is that there’s been plenty of economic data out of the world’s largest economy lately which might suggest it’s not exactly crying out for economic stimulus. Overall growth data for 2023’s last quarter was much stronger than expected. While that series is open to accusations of being a little historic now, January’s more up-to-date consumer confidence snapshot found consumers more upbeat than at any time since late 2021. The labor market remains pretty tight, too.
What this means for the near-term is that the idea of a US interest rate cut as soon as March looks more uncertain than it did. If the Fed does anything to underline this view, causing expectations of action to be pushed back further, the Dollar could gain further.
The Japanese economy is also seeing some jobs-market strength according to the most recent numbers. Enduring wage growth is probably the single key factor after inflation most likely to see the Bank of Japan tighten its ultra-loose monetary policy at long last. However, it has already declined to do so once in 2024. While the debate as to when it might will run on, for now, trade in USD/JPY is all about the Fed.
USD/JPY Technical Analysis
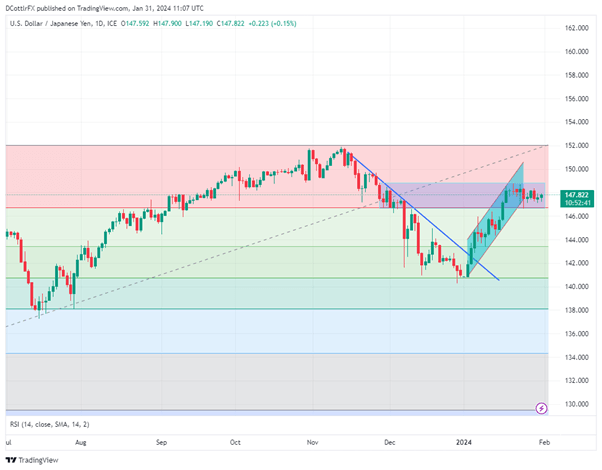
USD/JPY Chart Compiled Using TradingView
There are some clear similarities in the daily charts of both USD/JPY and GBP/USD, with both pairs establishing trading ranges close to recent highs and bounded at their lower edges by key Fibonacci retracement levels.
In USD/JPY’s case that comes in at 146.724, a support level which has held since mid-January. Resistance at the band’s upper limit is at 148.805, the intraday top of November 28. Dollar bulls will need to get a lot more comfortable above the 148 psychological resistance level than they have in the last couple of weeks. Whether or not that happens seems highly dependent on the fundamentals.
IG’s sentiment data finds traders profoundly bearish on USD/JPY at the moment, to the tune of 73% expecting falls. This might well be the sort of level that argues for a contrarian bullish play.
–By David Cottle for DailyFX
DailyFX provides forex news and technical analysis on the trends that influence the global currency markets.


